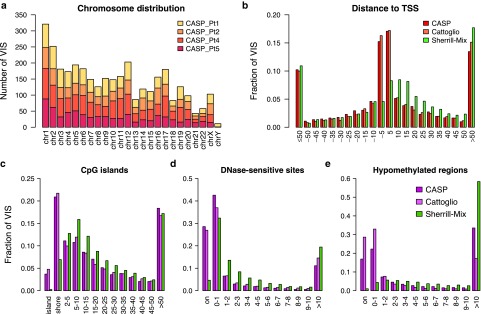
Figure 1.
Distribution of VIS by chromosome and mapped distance to functional DNA elements. (a) Chromosomal distribution of VIS detected in four patients. (b) Mapped distance distribution of VIS to nearest RefSeq TSS binned at 5 kb distance intervals centered about TSS. Negative distances denotes upstream of TSS. (c) Mapped distance distribution of VIS to nearest CpG island (UCSC). VIS mapped to nearest CpG island are annotated as “island” (zero distance), “shore” (up to 2 kb), “2–5 kb” then set at 5 kb distances intervals up to 50 kb. (d) Mapped distance distribution of VIS to nearest DNaseI-hypersensitive site in CD3+ T-cell genome (Epigenetic Roadmap Project EID: E034; narrowPeak). VIS at zero distance (“on”) and then set at 1 kb distance intervals up to 10 kb. (e) Mapped distance distribution of VIS to nearest hypomethylated region in human peripheral blood mononuclear cell genome (ENCODE dataset36). VIS at zero distance (“on”) and then set at 1 kb distance intervals up to 10 kb. (b–e) Percent of total VIS found per experiment dataset (CASP, this study; Cattoglio = Cattoglio et al.13; Sherrill-Mix = Sherrill-Mix et al.14). TSS, transcriptional start site; VIS, vector integration sites.

