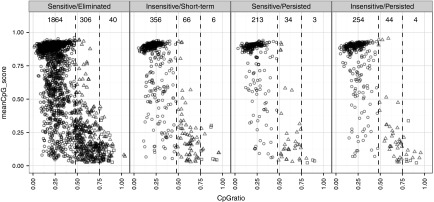
Figure 4.
CpG methylation profile for vector integration sites (VIS) flanking regions. Scatter plots showing mean CpG dinucleotide methylation status (0.0–1.0; null to methylated) versus CpG ratio over ± 1 kb VIS-flanking region. Each point represents one VIS and is classified as low CpG promoters (LCP: circle), intermediate CpG promoters (ICP: triangle), or high CpG promoters (HCP: square). Scatter plots are subcategorized according to chemical inducer of dimerization (CID) response profile (Sensitive/Eliminated, Insensitive/Short-term, Sensitive/Persisted, Insensitive/Persisted) and their pre-CID copy number levels.

