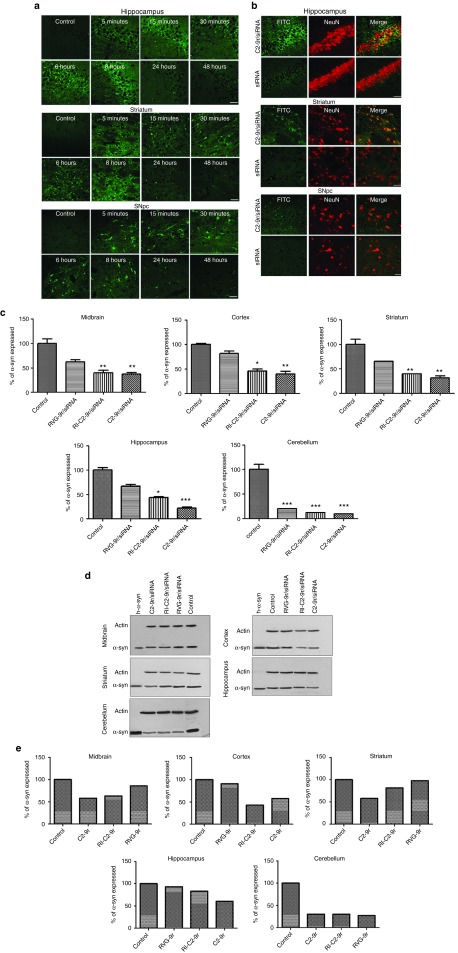
Figure 4.
Nonviral vectors mediate transvascular delivery of siRNA and gene knockdown in vivo. (a) Naive mice (n = 5) were injected intravenously with PBS (control) or biotinylated-C2-9r in PBS. The animals were sacrificed at indicated time points postinjection after which the brains were collected and postfixed. Coronal sections from the brain were processed for immunofluorescence analysis with anti-biotin antibody and detected with an anti-FITC secondary antibody to visualize immunoreactivity of the biotinylated vector in the brain. Fluorescence signals from C2-9r injected mice in the hippocampus, striatum, and substantial nigra pars compacta (SNpc) over time are shown. Bar = 100 μm. (b) Naive mice (n = 6) were injected intravenously with C2-9r complexed to FITC-labeled siRNA (siRNA-FITC) or with siRNA-FITC alone after which the brains were fixed and coronal sections were processed for double immunofluorescent staining with the neuronal marker NeuN (red) and with an anti-FITC antibody (green) to visualize siRNA within neurons. Fluorescence signals from injected mice in the hippocampus, striatum, and SNpc are shown. Bar = 100 μm. Naive mice (n = 5) were injected intravenously with scrambled siRNA (control) or SNCA siRNA complexed with C2-9r, RI-C2-9r or RVG-9r for 3 consecutive days. Different regions within the brain of the injected animals were examined for α-syn protein expression 2 days after the last injection by ELISA (c) and western blot (d). ELISA data are represented as mean values ± SD. (***P < 0.001, **P < 0.01, *P < 0.05, two-way ANOVA). (e) Histograms represent quantification of α-syn protein expression by western blotting, expressed as percentage of the control.

