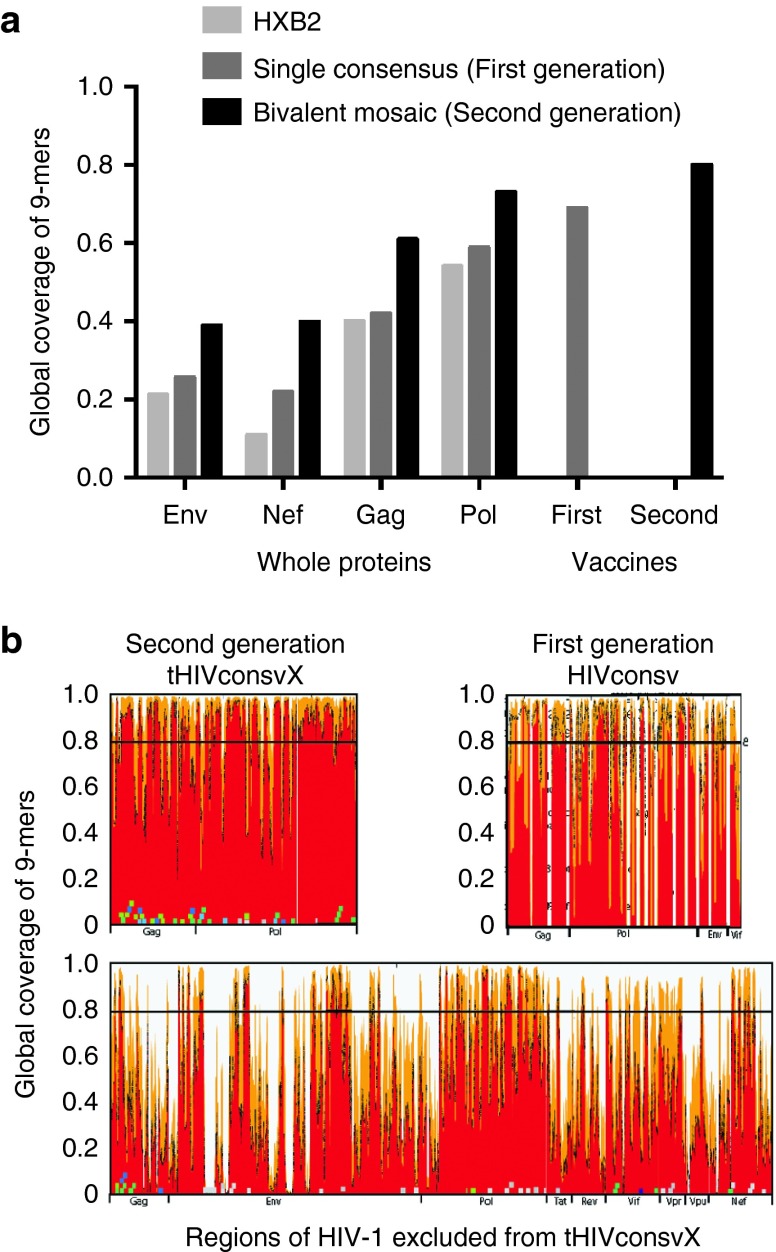
Figure 2.
Comparisons of epitope coverage using different vaccine strategies. Graph (a) shows a comparison of the global PTE coverage with 9/9 aa match, contrasting the coverage provided by a natural virus isolate HXB2 (light grey), a single consensus3 (dark grey), and bivalent mosaics (black). Four whole HIV-1 proteins that are commonly included in vaccines are compared with the regions included in the HIVconsv (first-generation) and tHIVconsvX (second-generation) immunogens. This calculation is not alignment based—all 9-mers in each protein in the original alignment are extracted, gaps are excluded and the fraction of 9-mers that are covered (i.e., perfectly matched) by the vaccine candidate is calculated. This number is equivalent to the average number of epitopes per natural strain that are matched by a given vaccine candidate. (b) These graphs show the match with group M 9-mer PTE variant sequences for the regions of the second-generation tHIVconsvX bivalent mosaic (top left), those of the first-generation HIVconsv consensus amino acid sequences (top right) and the rest of the HIV-1 proteome after removing the second-generation regions (bottom). The white vertical gaps in the conserved-region vaccines figures indicate the boundaries of each of the included regions. The top left and bottom figures are essentially a reordering of the data shown in Figure 1a, to enable a visual comparison of epitope coverage in the second-generation vaccine relative to the rest of the proteome.

