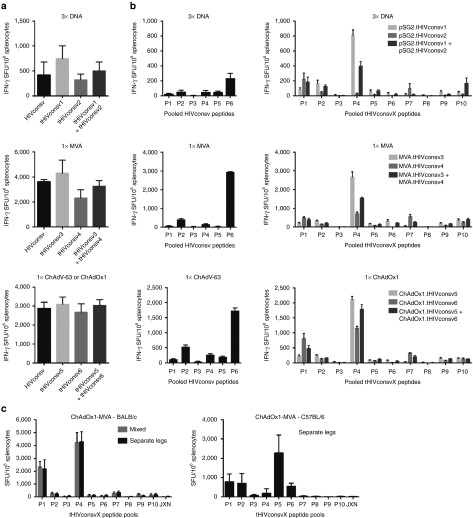
Figure 4.
Comparable immunogenicity of the first- and second-generation of conserved-region vaccines in mice. Groups of six BALB/c mice were immunized with either the first- or second-generation immunogens as indicated below the graphs. The immunogens were vectored by DNA, MVA, or one of the chimpanzee adenoviruses ChAdV-63 (first generation) or ChAdOx1 (second generation) as shown above the graphs. Vaccine-elicited, conserved-region-specific T cells were enumerated in a fresh unexpanded IFN-γ ELISPOT assay using 15-mer peptides overlapping by 11 amino acids assembled into 6 pools P1–P6 or 10 pools P1–P10 of over 30 peptides each corresponding to the first-(HIVconsv) and second (tHIVconsvX)-generation vaccines, respectively. Graphs show (a) the totals (sum of all pools) of net T-cell frequencies as spot-forming units (SFU) per million of splenocytes for each vaccine modality indicated above the graphs and (b) the net frequencies of T cells recognizing individual peptide pools. (c) BALB/c and C57BL/6 mice were vaccinated using the rChAdV prime-rMVA boost regimens using mixed or anatomically separated deliveries of the two mosaic immunogens. JXN indicates a pool of junctional peptides. Frequencies are shown as mean ± SEM (n = 6).

