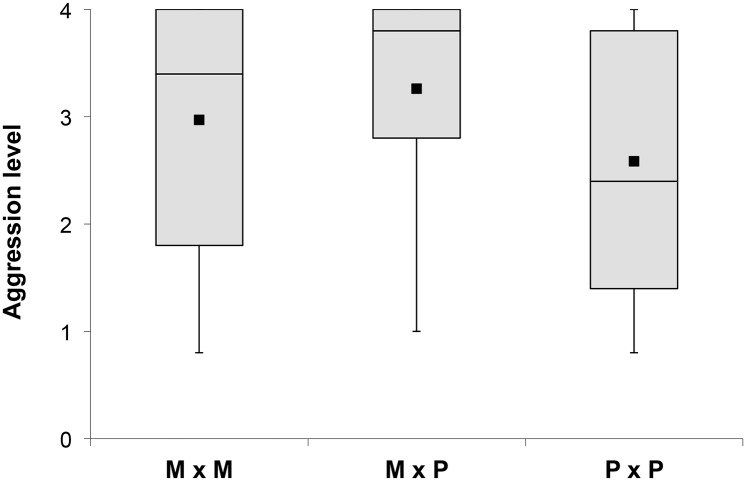
Fig 2. Aggressiveness between workers from monogyne colonies (M x M), from polygyne colonies (P x P) and from monogyne and polygyne colonies (M x P).
The closed square indicates the mean of the highest score per replicate, the black bar corresponds to the median, the box is the interquartile range (IQR) and the whiskers represent the lowest datum still within 1.5*IQR of the lower quartile, and the highest datum still within 1.5*IQR of the upper quartile (S2 and S3 Tables).

