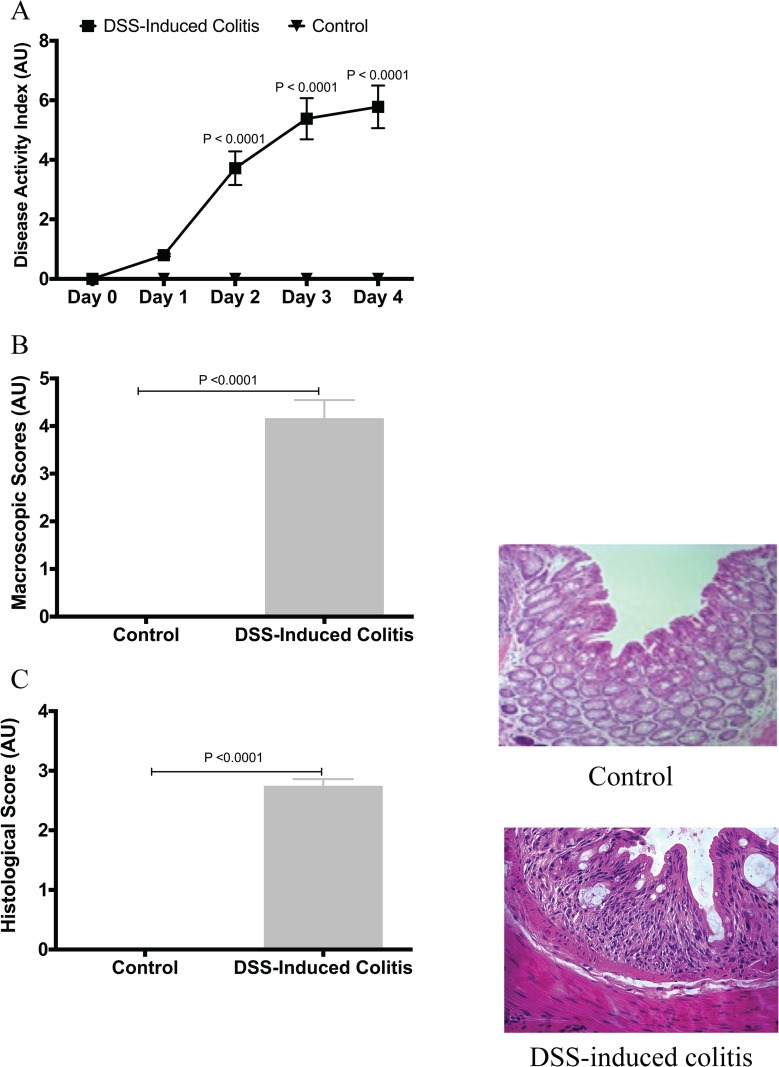
Fig 1. Confirmation of colitis induction by dextran sulphate sodium (DSS).
(A) Disease activity index, repeated measures ANOVA analysis followed by the multiple comparisons post hoc analysis; (B) macroscopic scores; (C) histological score. Control represents data obtained in non-colitic non-treated mice (n = 6/group). Student’s t-test analyses were used to compare DSS-treated group to the control group. Data are presented as the mean ± SD.

