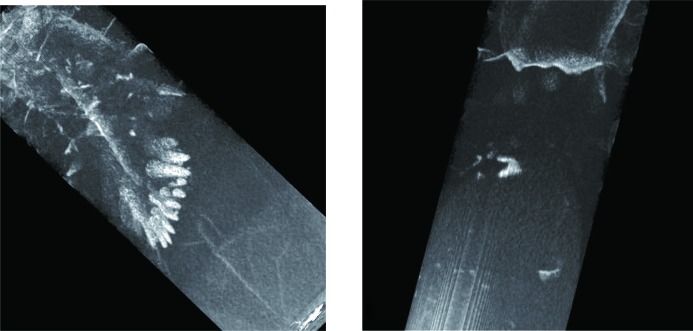
Figure 14.
Tomographic reconstructions of the BaBrCl:0.1%Eu sample revealing the cracks, with their location correlated with the locations of Eu deficiency. More details of the internal crack locations are shown in Fig. 15. Two sample orientations are shown, with cracks propagating deep into the sample.

