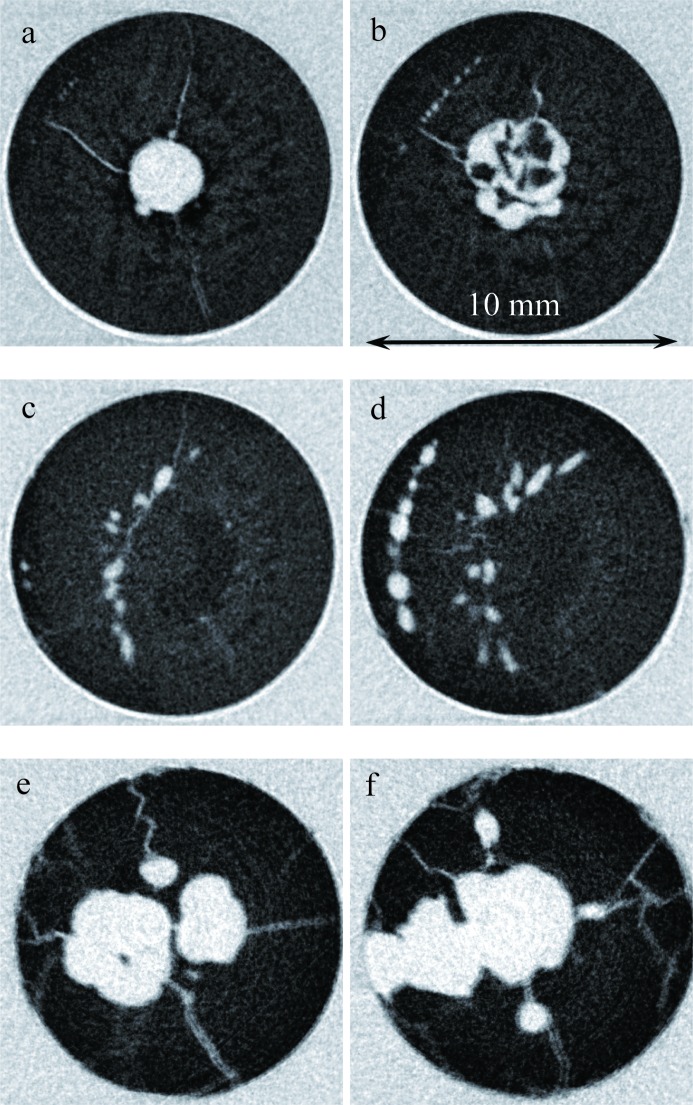
Figure 15.
Slices through the tomographic reconstruction of the BaBrCl:0.1%Eu sample. The letters in each part are the locations of the slices within the sample as indicated in Fig. 13 ▸. All the cracks observed in that sample originate within an Eu-deficient volume.

