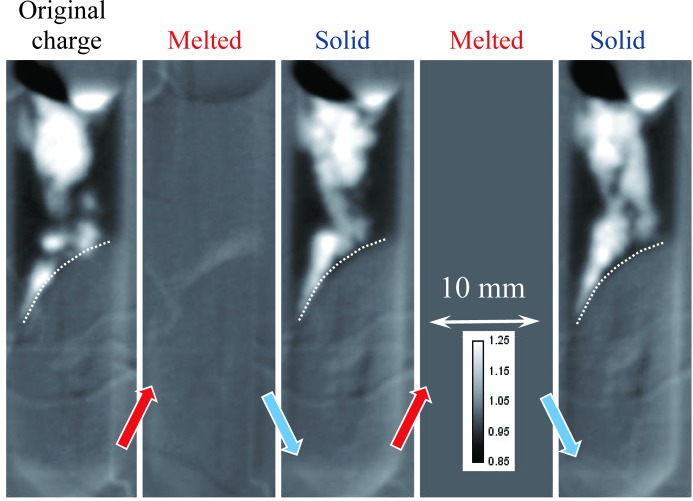
Figure 8.
The same as Fig. 7 ▸, except normalized by the second melted state. The dependence on sample thickness is eliminated by this normalization. Only differences between the solid and melted states are seen in these images. The lighter areas correspond to Eu deficiency, while darker areas show increased Eu concentration compared with the melted state. The dashed lines indicate the approximate position of the interface between the melted and original charge sections of the sample.

