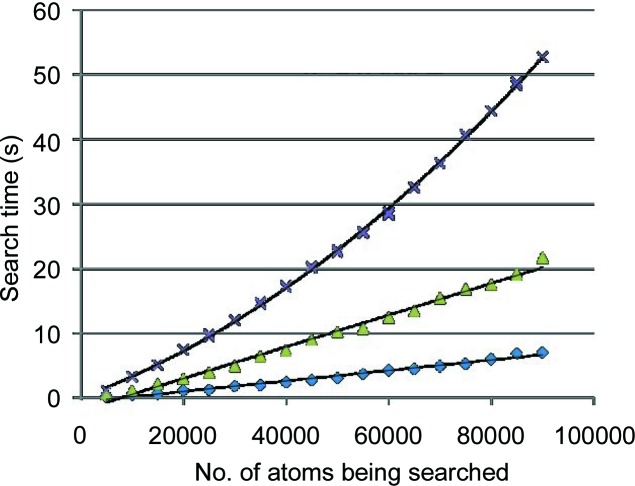
Figure 7.
Using NearTree to identify nearest neighbors for each atom in partial sets of coordinates from PDB entry 1jj2 (Klein et al., 2001 ▸). For each group, every atom is searched for its nearest neighbor. The expected order is O[nlog(n)]. The top curve is for all atoms in a group inserted into the tree in sequential order. The middle curve is for initially inserting n 1/2 randomly selected points. The bottom curve uses more insertion randomization based on measured differences in subtree depths, as well as applying the ‘flip’ logic discussed in §8.

