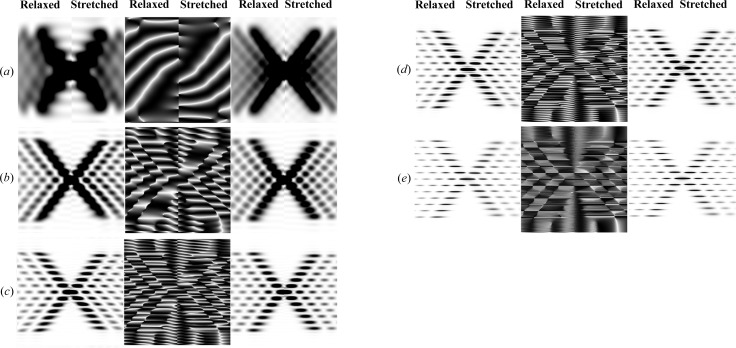
Figure 5.
The effect of length changes of helical wire structures on the calculated Fourier transforms of stretched and relaxed helices. Intensities at Ψ = 0 are shown in the left-hand panels, unless otherwise specified, while the phases at the specified Ψ are shown in the middle and the intensities averaged over all Ψ are on the right-hand side. In each panel, the left half is the relaxed pattern (undistorted helices) and the right half is the stretched pattern (distorted helices). The following helical parameters are used: six Bessel functions used to calculate the total transform on any given layer line, subunit distance 27.3 Å, length of one pitch 59.15 Å, radial position of a subunit (helix radius) 25 Å, 13 subunits in six turns. In all cases, the strain, Δ∊, increases linearly from 0 to 20% for different helix lengths: (a) a half pitch, Ψ = π/2; (b) one pitch; (c) two full pitches; (d) three full pitches; and (e) six full pitches. The change of strain, Δ∊, increases linearly from zero to a maximum strain of 20% over the length of the helical wire,  , thus causing the amount of stretch per pitch to decrease with increasing
  . Different pitches are chosen to best visually show the differences between the stretched and relaxed helices. Note that the higher-order layer lines show a larger distortion of the predicted X-ray reflections (including a reduction in intensity of the layer lines) and they are more prominent for longer helices. In the phase images, white indicates a phase of π radians and black a phase of −π radians.

