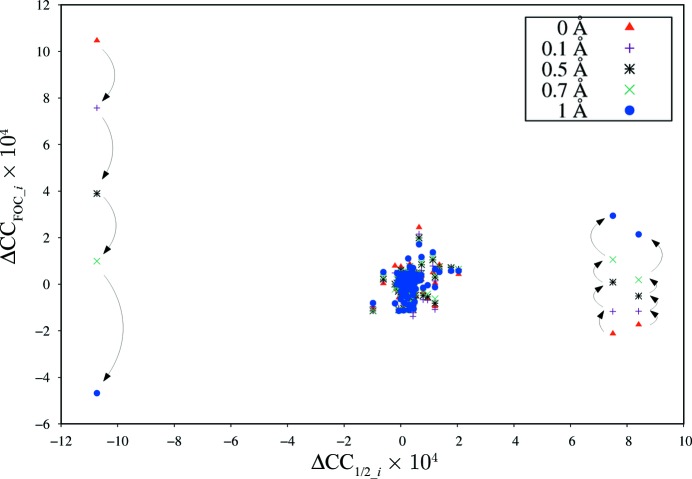
Figure 4.
Plot of ΔCCFOC_i against ΔCC1/2_i for AlgE. Different colours and marker symbols refer to the different random shifts of the atom coordinates. Arrows indicate the change of ΔCCFOC_i upon increasing the magnitude of random shifts for the three most significant outliers of the Gaussian distribution of Fig. 3 ▸.

