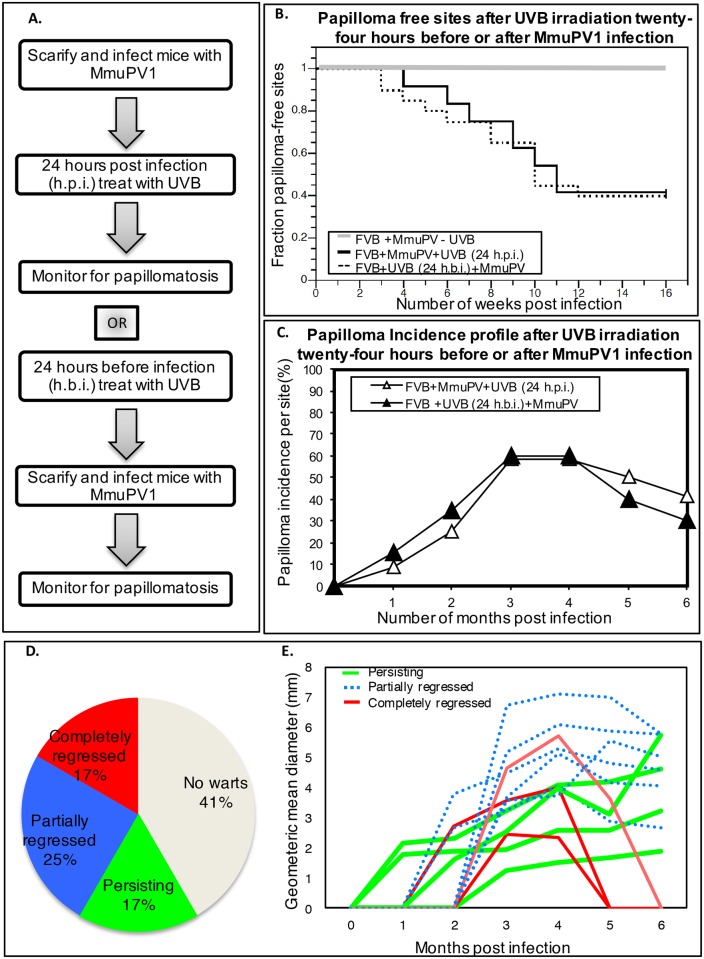
Fig 1. MmuPV1-induced papillomas in UVB-irradiated FVB/NJ mice.
(A) Sequence of manipulations to FVB/NJ mice in the MmuPV1-UVB infection model system. Ear sites were scarified and exposed to 108 VGE of MmuPV1 either 24 hours before (FVB+UVB 24h.b.i.+MmuPV) or 24 hours after (FVB+MmuPV+UVB 24h.p.i.) 300mJ/cm2 UVB whole-body irradiation. Sites were then scored weekly for presence of papillomas. (B) Kaplan-Meyer plots of the fraction of papilloma-free infected ear sites with respect to time. There is no significant difference in the temporal onset of disease between the two experimental groups (FVB+UVB24h.p.i.+MmuPV vs FVB+MmuPV+UVB 24h.b.i.; P = 0.814, Wilcoxon log-rank test, two-sided). (C) Percentage of sites with overt papillomas over a 6-month observation period. In both the cohorts of mice, a subset of papillomas completely regressed by 6 months post-infection. (D) Distribution of ear sites of UVB-treated FVBN/J mice (FVB+UVB24h.p.i.+MmuPV group) infected that developed papillomas that completely regressed (red), partially regressed (blue) or continued to grow (green) over the 6 month monitoring period. In grey is the fraction of sites that did not develop papillomas. (E) Growth profiles of individual papillomas arising in the FVB+UVB24h.p.i.+MmuPV group during the 6-month monitoring period. Individual lines represent the geometric mean diameter of each papilloma as a function of time. Red lines are papillomas that completed regressed. Blue lines are papillomas that partially regressed. Green lines are papillomas that continued to grow.

