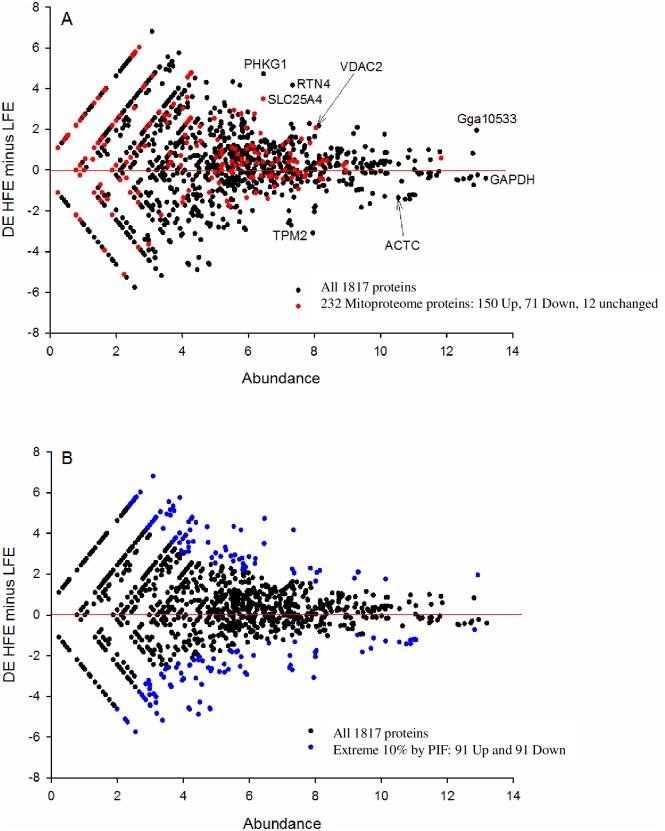
Fig 2. The protein abundance for the difference (Minus [M] for high FE minus low FE) and protein abundance alone (A) for all proteins.
The MA plot is consistent with a reduction in slow fiber subunits (TPM2, ACTC) in the high FE (HFE) and an increase in mitochondrial regulators of muscle energy supply in the form of ATP (SLC25A4) and creatine phosphate (VDAC2). GAPDH is the most abundant protein we identified. Further, the mitoproteome (highlighted in red, Fig 2A) is skewed towards the HFE consistent with a higher mitochondrial content. Highly differentially expressed proteins were identified by a metric called Phenotypic Impact Factor (PIF), with the extreme 10% highlighted in blue (Fig 2B). Abbreviations: (RTN4), reticulon 4; (PHKG1), phosphorylase kinase gamma 1; (SLC26A4), adenine nucleotide translocase 1; (ACTC), alpha actin cardiac; (Gga), golgi associated gamma adaptin; (GAPDH) glyceraldyhde 3-phosphate dehydrogenase; (TPM2), tropomyosin 2.

