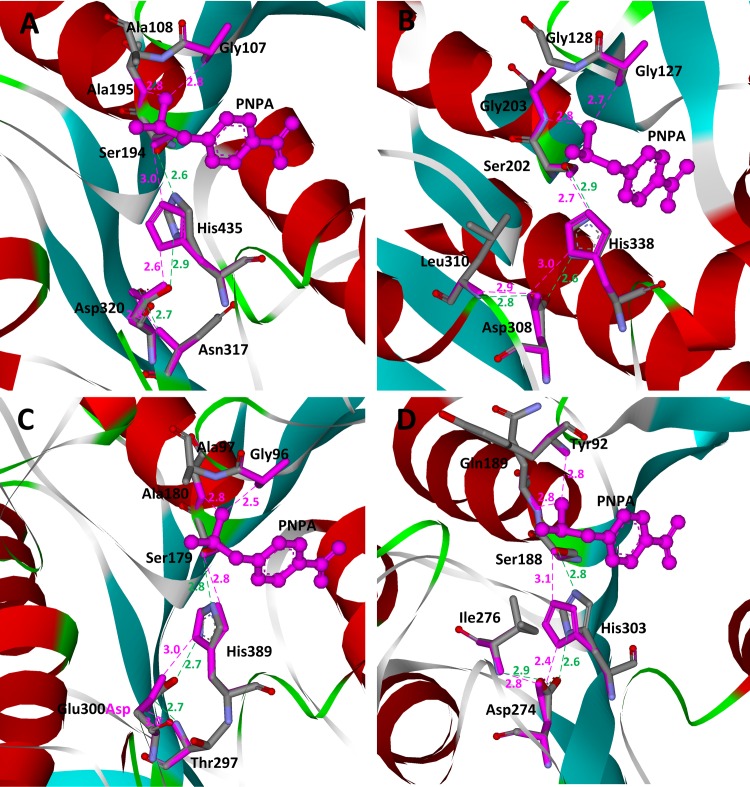
Fig 6. Superposition of native and predicted active sites for hydrolysis of PNPA on scaffolds.
(A) 1f6w; (B) 1jkm; (C) 1qe3; (D) 3m83. The transition states are shown in ball and stick model and colored in pink. The active site residues are shown in stick model. Atoms O, N, and C in crystal structures are colored in red, teal, and gray, respectively. Matched residues are colored in red. The hydrogen bonds in crystal structures are shown in dotted green lines, and the predicted hydrogen bonds are shown in dotted pink lines. The distances between hydrogen bonding donors and acceptors are shown in Å and labeled besides the dotted lines.

