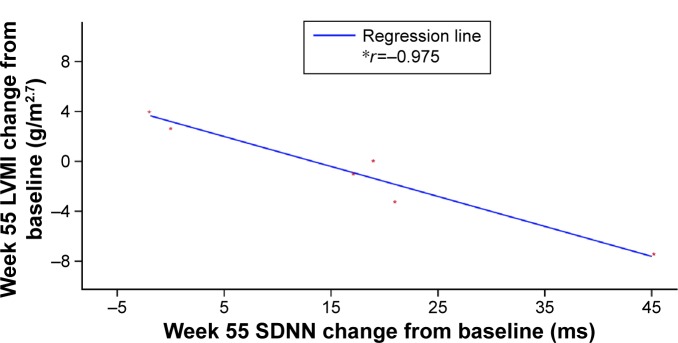
Figure 3.
Correlation between change from baseline to week 55 in SDNN and LVMI in patients with baseline SDNN <100 ms.
Notes: *r = Pearson correlation coefficient. SDNN represents the standard deviation of all filtered RR intervals for the length of the analysis.
Abbreviation: LVMI, left ventricular mass index.

