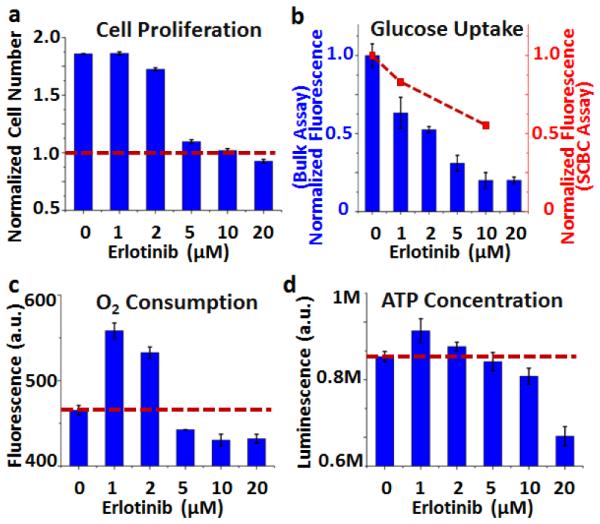
Fig. 4.

Functional and metabolic bulk assays on U87EGFRvIII cells treated with various concentrations of erlotinib for 24 hrs. (a) Normalized cell numbers after 24 hours. The red line shows the plating number. (b) Glucose uptake results from bulk (blue bars) and SCBC assays (red dots). (c) Oxygen consumption and (d) ATP concentration assay results. The red lines show the levels from the control samples.
