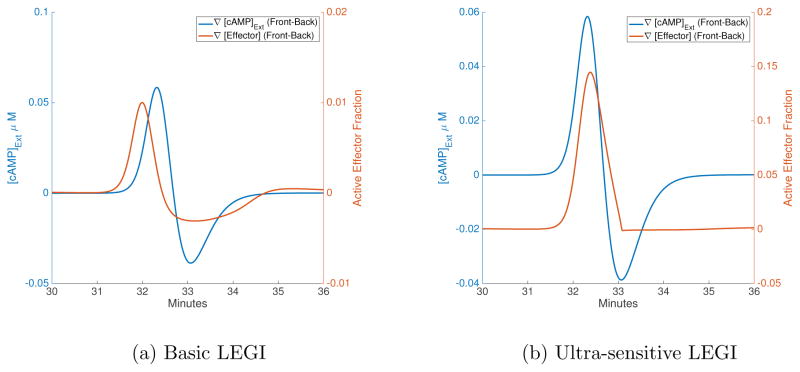
FIG. 3.
Time-series of gradients in cAMP and effectors across a cell. The blue lines are the difference in extracellular cAMP conc. between front and back edges of a cell, while the orange line is the corresponding difference in effector levels. When the blue line is positive, the cell is exposed to the rising phase, while the falling phase corresponds to negative difference in cAMP. While the basic LEGI model (a) has a noticeable response in the back of the wave, this response is muted for the ultra-sensitive model (b).

