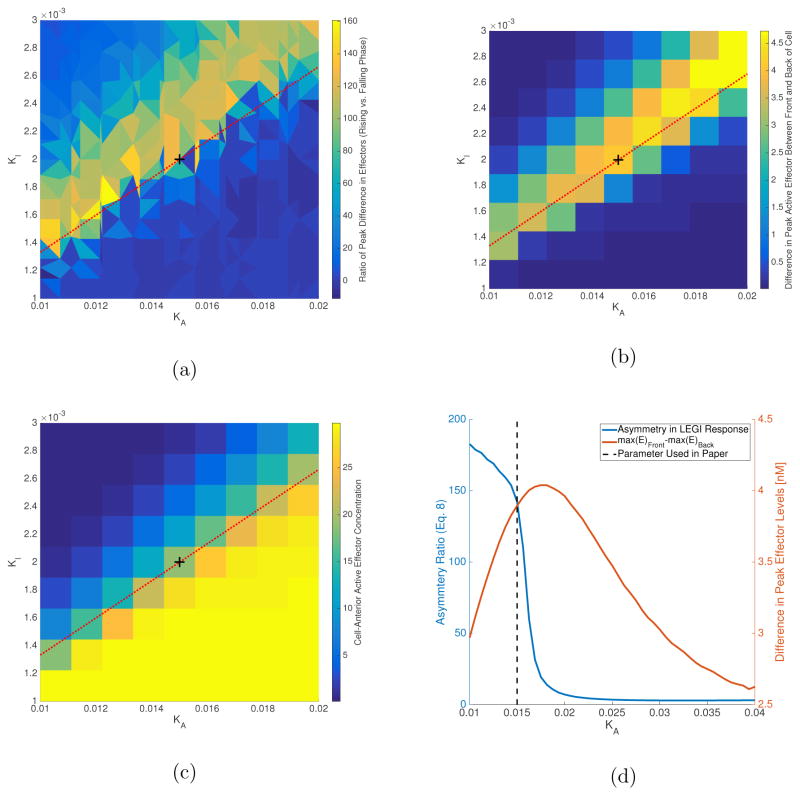
FIG. 4.
(a) Parameter region for large asymmetry in LEGI response. Results from a sampling of 100 parameter combinations were used to interpolate results shown here. We used a biharmonic spline interpolation available in MATLAB®. (b) Difference in peak active effector levels between front and back of the cell. Total effector concentration is assumed to be 30 nM, same as total receptor concentration. Results are shown for 100 simulations. (c) Peak effector values at cell-front for sampled parameter space. Above the red-dashed line, peak effector levels drop below 50% of total effector levels, while below the line it reaches almost full activation. The peak effector levels at the back of the cell (not shown here) exhibit a similar trend. (d) Asymmetry and difference in peak effector levels along red-dashed line. Asymmetry gets large for KA values less than 0.02, however, the difference in peak active effector levels starts to drop in this region. The value for KA is selected such that we can get high asymmetry while maintaining a difference in peak effectors close to maximum achievable along the red-dashed line (~4 nM). The black dashed-line marks the parameter values used in this paper. These parameters are also marked in Figures 4a–4c with a black plus-sign.

