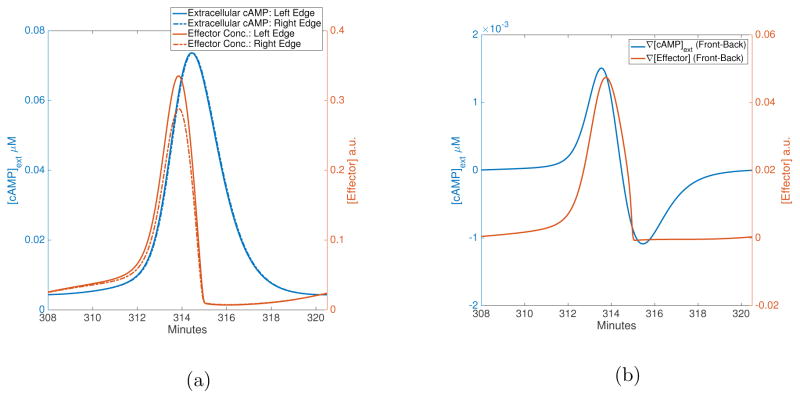
FIG. 5.
LEGI response to wide waves. (a) The extracellular cAMP (blue) waves at the front (solid line) and the back of the cell (dashed line) are shown along with the corresponding effector values (red lines). Compared to the ultra-sensitive LEGI model with regular waves (fwhm=0.3 mm, Figure 2d), the response in effector drops to zero almost exactly as the rising phase of the wave ends. This is even clearer in (b), which shows the difference in cAMP levels (blue) and effector values (red) for the same cell. The difference returns to zero almost concurrently with the beginning of the falling phase of the wave. Essentially, the wider wave is slow enough that the LEGI model reaches saturation before the cAMP wave peak completely passes the front of the cell.

