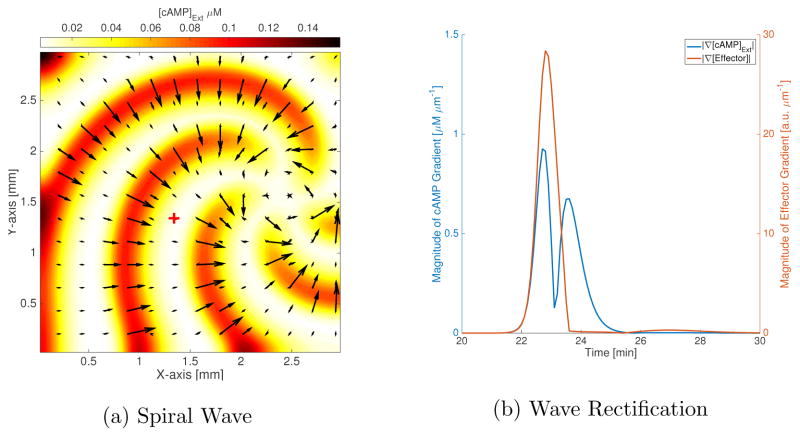
FIG. 6.
Spiral waves in 2D. (a) The colorbar indicates the extracellular cAMP concentrations (in units of μM), which are shown with filled contours. The black arrows are the mean effector gradient across the cell using a Cartesian grid. The wave travels radially outwards, normal to the curvature of spiral. We have shown the spiral at 5 different times (starting with the small tip at the right edge and going clock-wise, the respective times are 14.4 min, 16.9 min, 19.4 min, 21.9 min and 24.4 min), along with vectors for the effector gradients corresponding to each time-step superimposed over one another (this results in some of the larger black arrows having smaller arrows at their base which corresponds to a different point in time). The response in the falling phase of the wave is suppressed; cells are only responding significantly to the rising phase of the wave (the arrows are small everywhere but on the wave-front). The gradients are perfectly aligned with the normal to the spiral, except at the tips of the spiral. (b) The magnitude of effector gradient (red) and cAMP gradient (blue) at cell position (1.34mm,1.34mm), shown as a cross in (a). The dip in the cAMP gradient magnitude corresponds to the peak in the cAMP wave at cell position, the left of the dip is the rising phase while to the right lies the falling phase of the cAMP wave. There is a large effector gradient in response to the cAMP gradient, with its peak within 6 seconds of the cAMP gradient peak, for the rising phase of the wave. In the falling phase of the wave, the peak in cAMP gradient does not elicit a strong response in the effector gradient. The effector gradient peak for the rising phase is ~140 times stronger than the effector gradient 6 seconds after the cAMP gradient peak in the falling phase.

