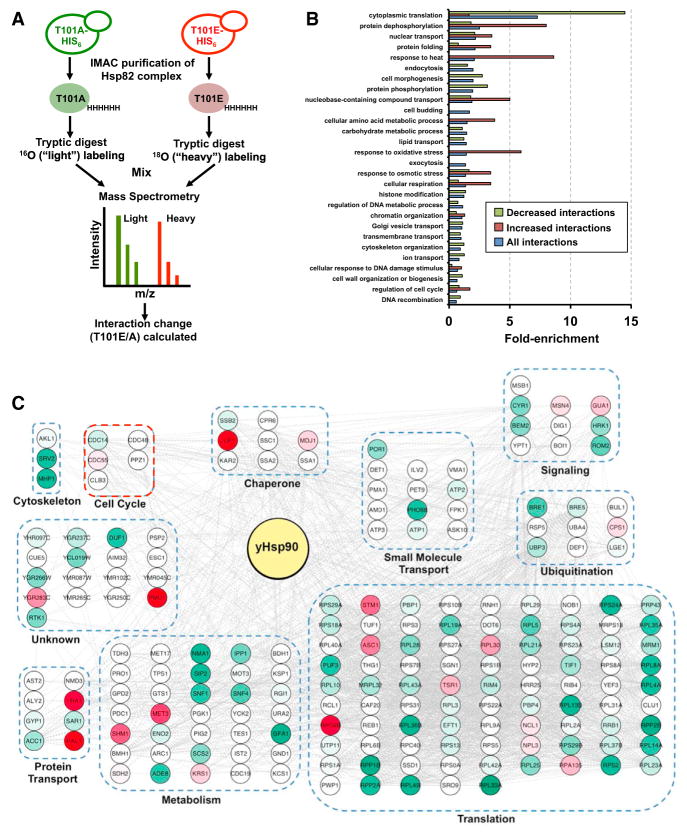
Figure 5. T101 Phosphorylation Alters the yHsp90 Interactome.
(A) A schematic illustration of the methodology used to identify the yHsp90 interactome. Cells expressing either T101A- or T101E-yHap90-His6 were grown to mid log. yHsp90 complexes purified via immobilized metal ion affinity chromatography (IMAC) and trypsinized. T101E-yHsp90-His6 interacting peptides were isotopically labeled with 18 O, mixed 1:1 with T101A-yHsp90-His6 interacting peptides, and then analyzed by quantitative LC-MS/MS.
(B) GO term analysis of yHsp90 interactors. They were classified by cellular process using GO Slim. Enrichment for each process is shown relative to occurrence in non-essential genome.
(C) Effect of T101 phosphorylation on yHsp90 interactome. yHsp90 interactors were grouped into non-redundant functional categories. Interactions are colored based on change; white nodes represent unchanged interactions, red nodes are significantly increased interactions, and green nodes are significantly decreased interactions.

