
Figure 1. Inhibition of ACC cell xenograft establishment and growth by ATR-101.
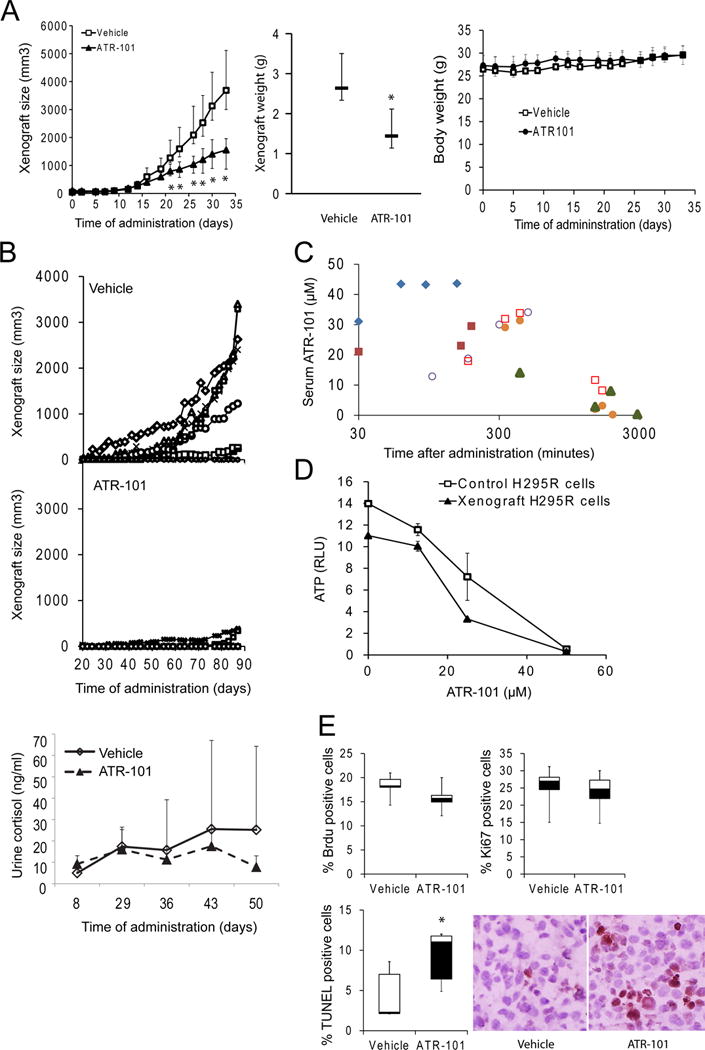
(A) Xenograft growth in mice that were administered ATR-101 (1 mg/g/day po) or vehicle starting when the mean size of the xenografts reached 100 mm3. The median and middle quartiles of the xenograft sizes and weights are plotted for each cohort. The median body weight for each cohort is shown in in the graph on the right.
(B) Xenograft establishment and growth, and urinary free cortisol levels in mice that were administered ATR-101 (0.7 mg/kg/day po) or vehicle starting two weeks after cell implantation. The sizes of the xenografts in individual mice that were administered vehicle (upper panel) or ATR-101 (middle panel) are plotted as a function of the time after beginning administration. The levels of urinary free cortisol were measured in the mice from each cohort that urinated during a 2 hour collection period and the mean and standard deviation are plotted as a function of the time after beginning administration (bottom panel).
(C) Pharmacokinetic analysis of the minimum serum concentration of ATR-101 that affected xenograft growth in mice. The concentration of ATR-101 in serum was measured using LC-MS at the times indicated after the administration of a single dose (0.3 mg/g po) of ATR-101. Each symbol indicates serum samples that were collected from the same mouse.
(D) Effects of long-term ATR-101 administration to mice on the sensitivity of cells reisolated from the xenografts to ATR-101. The ATP levels of H295R cells and cells that were reisolated from the xenografts of mice that that had been administered ATR-101 for 110 days were compared after 16 h culture in the presence of the indicated concentrations of ATR-101 or vehicle. The graph shows the means and standard deviations of three parallel cultures and is representative of two independent experiments.
(E) Effects of ATR-101 administration on the proportions of cortical xenograft cells that were stained by anti-BrdU antibodies (left graph), by anti-Ki67 antibodies (middle graph), and by TUNEL reagents (right graph and image to the right of the graphs). The median, middle quartiles and range are plotted for each cohort. The results shown are representative of two or more independent experiments. (*: p<0.05, Mann–Whitney non-parametric U-test, n=6)