
Figure 2. Mechanisms of ATR-101 cytotoxicity in cultured ACC-derived cells.
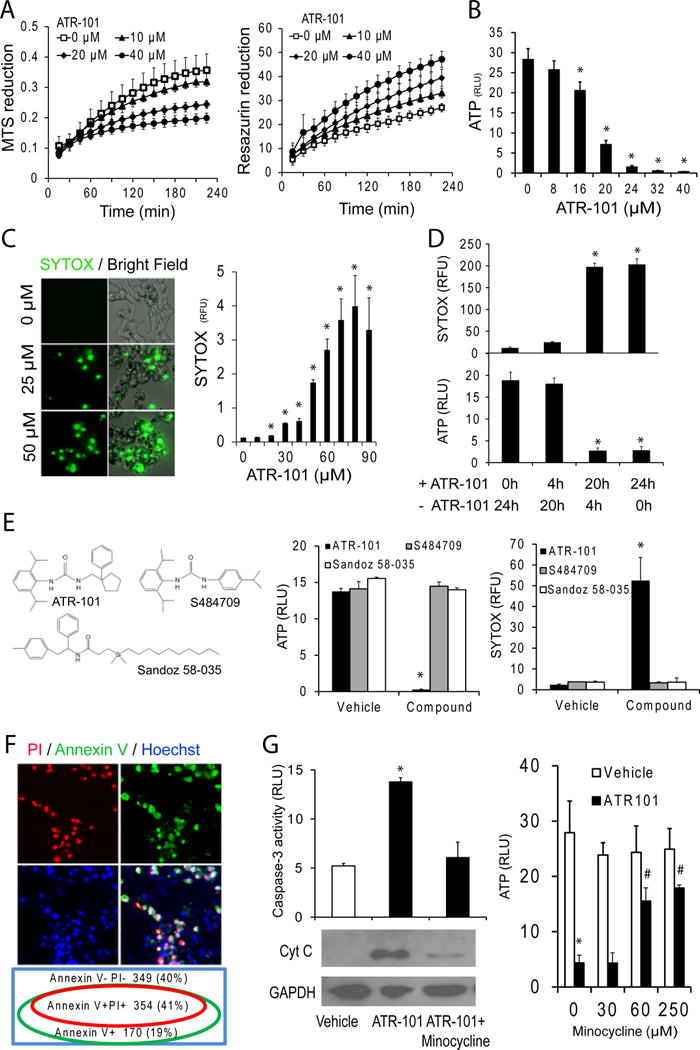
(A) Suppression of MTS reduction and enhancement of resazurin reduction in cells cultured with ATR-101. The MTS absorbance (left graph) and resazurin fluorescence (right graph) of H295R cells are plotted as a function of time after addition of the indicated concentrations of ATR-101.
(B) ATP depletion in H295R cells cultured with ATR-101. The ATP levels of H295R cells that were cultured in the presence of the indicated concentrations of ATR-101 for 20 h are plotted
(C) Membrane permeabilization in cells cultured with ATR-101. The SYTOX fluorescence in H295R cells that were cultured in the presence of the indicated concentrations of ATR-101 for 20 h is shown.
(D) Reversibility of membrane permeability and ATP depletion following ATR-101 removal at different times after exposure. The SYTOX fluorescence and ATP levels of cells that were cultured with 30 μM ATR-101 for the time indicated below the graphs (+ ATR-101), followed by culture without ATR-101 for the time indicated below the graphs (−ATR-101) are plotted. The graphs show the means and standard deviations from three replicate cell cultures and are representative of two independent experiments (*: p<0.05 vs 0h ATR-101; two-tailed unpaired Student’s t test).
(E) Comparison of the effects of ATR-101, a structurally related compound (Sigma S484709), and an ACAT inhibitor (Sandoz 58-035) on ATP levels and membrane permeability. The ATP levels and SYTOX fluorescence of H295R cells that were cultured with 40 μM of the indicated compounds for 24 h are plotted.
(F) Apoptotic markers in cells cultured with ATR-101. The Annexin V (green), Propidium Iodide (PI, red), and Hoechst (blue) fluorescence of H295R cells that were cultured in the presence of 30 μM ATR-101 for 20 h are shown. The Venn diagram indicates the percentage of cells labeled by each combination of fluorophores.
(G) Effects of the inhibition of cytochrome c release on ATR-101 cytotoxicity. The levels of cytochrome c and GAPDH in cytoplasmic extracts (lower images), caspase-3/7 activities (left graph) and ATP (right graph) in H295R cells that were cultured in the presence of vehicle, ATR-101 alone or ATR-101 in combination with minocycline for 16–20 h are shown.
All graphs plot the means and standard deviations for two or more replicate cultures. Each graph is representative of two or more independent experiments. (*: p<0.05 vs vehicle, #: p<0.05 vs ATR-101; two-tailed unpaired Student’s t test).