
Figure 3. Mitochondrial membrane hyperpolarization and fragmentation in cells cultured with ATR-101.
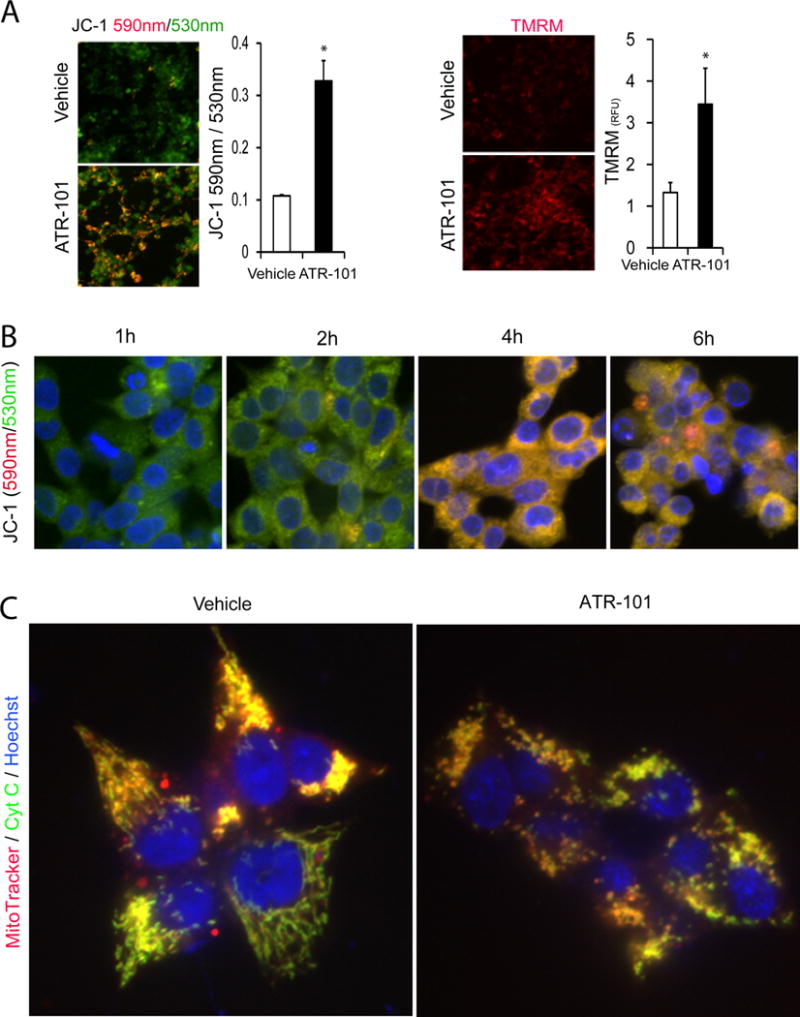
(A) Mitochondrial membrane hyperpolarization in cells cultured with ATR-101. The images show JC-1 [left panels; 530 nm (green), 590 nm (red)] and TMRM (right panels; 590 nm (red)) fluorescence in H295R cells that were cultured with vehicle (upper images) or with 30 μM ATR-101 (lower images) for 4 h. The graph on the left plots the JC-1 fluorescence emissions ratio (590 nm/530 nm) and the graph on the right plots the TMRM fluorescence intensity. The graphs plot the means and standard deviations of three replicate cultures, and are representative of data from two or more independent experiments (*: p<0.05 vs vehicle; two-tailed unpaired Student’s t test).
(B) Timing of mitochondrial membrane hyperpolarization in cells cultured with ATR-101. The images show JC-1 fluorescence [530 nm (green), 590 nm (red)] of H295R cells that were cultured with 40 μM ATR-101 for the times indicated, followed by incubation with JC-1.
(C) Mitochondrial fragmentation in cells cultured with ATR-101. The MitoTracker (red) and anti-cytochrome c (green) fluorescence of H295R cells that were cultured with vehicle (left image) or with 50 μM ATR-101 (right image) for 6 h are shown.
The images are representative of the large majority of cells in each population and of data from two independent experiments.