
Figure 5. Suppression of ATR-101 cytotoxicity by α-tocopherol.
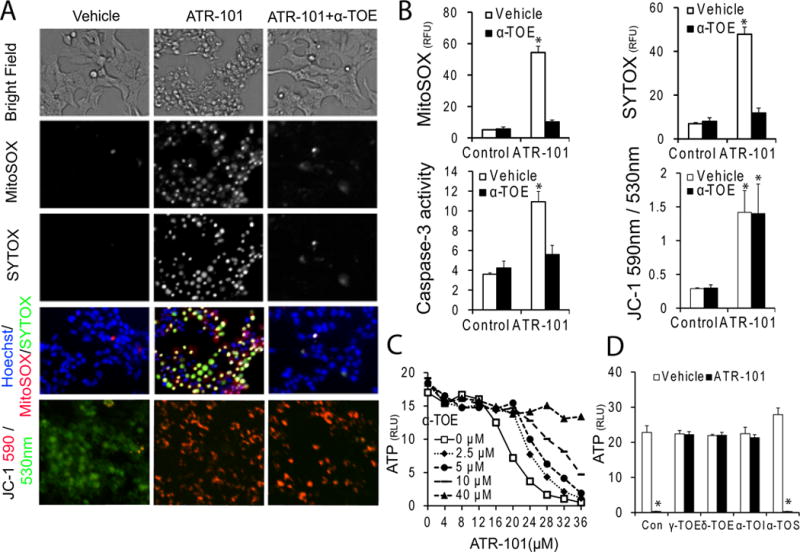
(A) α-tocopherol suppresses the effects of ATR-101 on superoxide levels and on mebrane permeability, but not on mitochondrial hyperpolarization. The left column shows cells cultured with vehicle, the middle column shown cells cultured with 30 μM ATR-101 alone, and the right column shows cell cultured with 30 μM ATR-101 and 40 μM α-tocopherol (α-TOE). The upper 4 rows show phase contrast (top row), MitoSOX fluorescence (second row), SYTOX fluorescence (third row) and merged MitoSOX (red), SYTOX (green) and Hoechst (blue) fluorescence (fourth row) for the same field of H295R cells after 20 hour culture with the indicated compounds. The bottom row shows JC-1 fluorescence [530 nm (green); 590 nm (red)] of H295R cells after 6 hour culture with the indicated compounds.
(B) Differential effects of α-tocopherol on the superoxide levels, membrane permeability and caspase-3/7 activities versus mitochondrial membrane potential of cells cultured with ATR-101. The MitoSOX (upper left), SYTOX (upper right) and JC-1 (lower right) fluorescence, as well as the caspase-3 activity (lower left) are plotted for H295R cells that were cultured with 30 μM ATR-101 and 40 μM α-tocopherol separately and in combination for 20 hours (MitoSOX, SYTOX and caspase-3) or for 3 hours (JC-1).
(C) Counterbalancing effects of α-tocopherol and ATR-101 on cell viability. The ATP levels of H295R cells that were cultured with the indicated concentrations of α-tocopherol and ATR-101 for 20 hours are plotted.
(D) Selective effects of different tocopherol derivatives on ATR-101 cytotoxicity. The ATP levels of H295R cells that were cultured with 40 μM of the indicated tocopherols together with 25 μM ATR-101 or vehicle for 20 hours are plotted (α-TOI: α-tocotrienol, α-TOS: α-tocopherol-succinate).
Each graph plots the means and standard deviations of three replicate cultures and is representative of data from two independent experiments (*: p<0.05 vs vehicle, #: p<0.05 vs ATR-101; two-tailed unpaired Student’s t tests). The images are representative of the large majority of cells in each population and of two or more independent experiments.