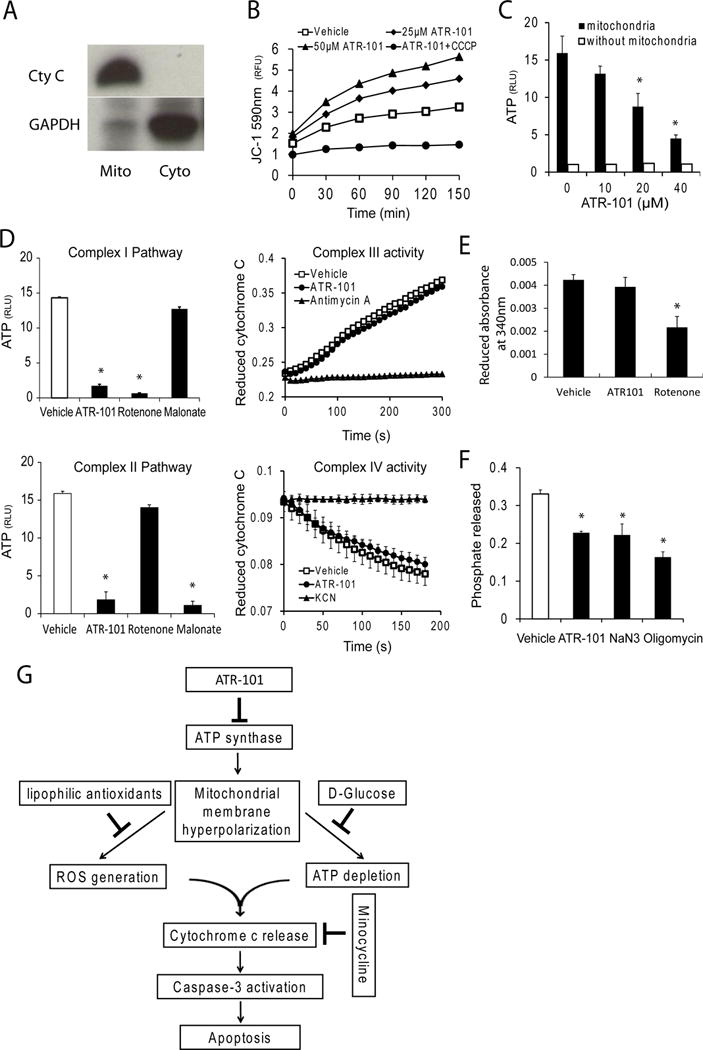
Figure 9. ATR-101 inhibits oxidative phosphorylation and F1F0-ATPase in mitochondrial fractions.

(A) Enrichment of mitochondria by differential centrifugation. Equal proportions of the mitochondrial pellet (mito) and cytoplasmic supernatant (Cyto) fractions were separated by SDS-gel electrophoresis and analyzed by immunoblotting blot using anti-cytochrome c and anti-GAPDH antibodies. The data shown are representative of two independent mitochondrial preparations.
(B) Membrane hyperpolarization in mitochondria respiring in the presence of ATR-101. The JC-1 fluorescence of mitochondria that respired in the presence of the indicated concentrations of ATR-101 alone or in combination with 5 μM CCCP for 30 minutes is plotted.
(C) Reduced ATP synthesis in mitochondria respiring in the presence of ATR-101. The ATP levels synthesized in mitochondria that respired in the presence of the indicated concentrations of ATR-101 for 30 minutes are plotted.
(D) ATR-101 inhibits ATP synthesis by Complex I and Complex II electron acceptors, but not electron transfer by Complex III or Complex IV. The amounts of ATP synthesized by mitochondria that respired in the absence or in the presence of ATR-101 using either Complex I (glutamate and malate; upper graph) or Complex II (succinate; lower graph) are plotted on the left. The rates of electron transfer by Complex III (cytochrome c reduction; upper graph) and by Complex IV (cytochrome c oxidation; lower graph) in mitochondria are plotted on the right.
(E) ATR-101 does not inhibit NADH oxidation by complex I. The graph shows the change in NADH absorbance that was produced by the respiration of mitochondria that were pre-incubated with vehicle, 50 μM ATR-101, or 10 μM rotenone
(F) ATR-101 inhibits F1F0-ATPase activity in isolated mitochondria. The graph shows the phosphate released by freeze-thawed rat liver mitochondria that were pre-incubated with vehicle, 50 μM ATR-101, 4 mM sodium azide (NaN3) or 5 μg/ml oligomycin for 30 minutes, followed by incubation with ATP for 10 minutes.
(G) Model for the mechanisms of ATR-101 cytotoxicity in cultured ACC-derived cells.
The graphs in panels C, D, E and F show the means and standard deviations of three replicate assays and are representative of at least two independent experiments (*: p<0.05 vs vehicle; two-tailed unpaired Student’s t test). The graph in panel B shows multiple reactions stopped at different times and is representative of two independent experiments.
