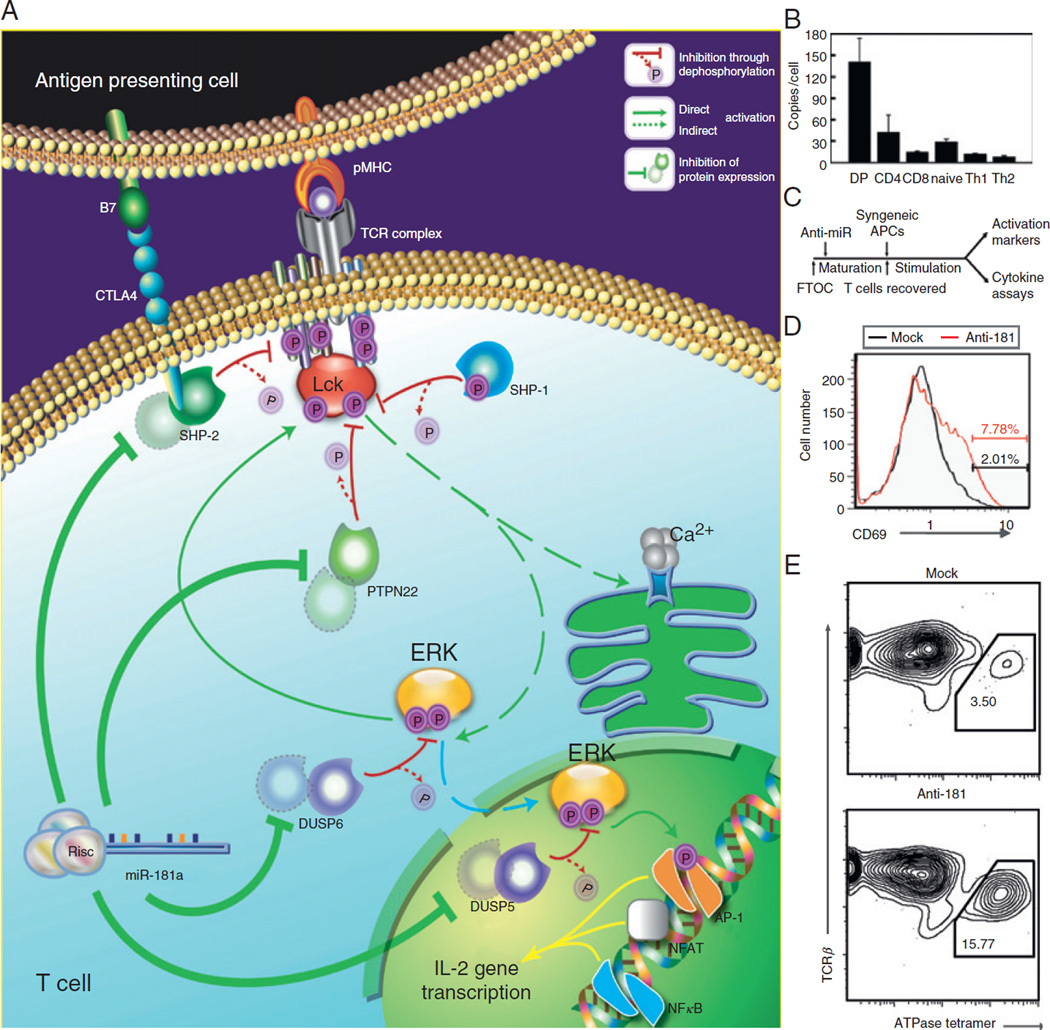
Fig. 4.
miR-181a-mediated hypersensitivity in thymic selection. (A) A schematic of miR-181a’s targets and their positions in a mature T cell’s TCR signaling cascade. (B) Expression level of miR-181a in developing T cell populations, as measured by quantitative real-time PCR. (C) Schematic of the protocol used to test the effect of miR-181a inhibition on T cell development. E16 FTOC were established and treated with antagomir specific for miR-181a, or with seed-region-scrambled antagomir which does not reduce miR-181a levels. After 5–6 days, mature T cells were harvested from these FTOCs, washed to remove any residual antagomirs, and then cocultured with syngeneic (B10.BR) splenic APCs. (D) B10.BR FTOC (in which T cells possess a normally diverse TCR repertoire) were treated in this way, and the resulting mature T cell populations were assayed for expression of the activation marker CD69 by FACS. Gated CD4+ T cells are shown: miR-181a inhibition in the FTOC resulted in a small population of autoreactive T cells. (E) 5C.C7β-transgenic B10.BR FTOC were treated as in part (C), and the resulting T cells were assayed using an ATPase 11c-I-Ek tetramer by FACS. Gated CD4+ T cells are shown: miR-181a inhibition in the FTOC resulted in an increased proportion of T cells that recognize the ATPase 11c self-peptide. Parts (A, B) are originally from Ref. 105 parts (C–E) are originally from Ref. 39.

