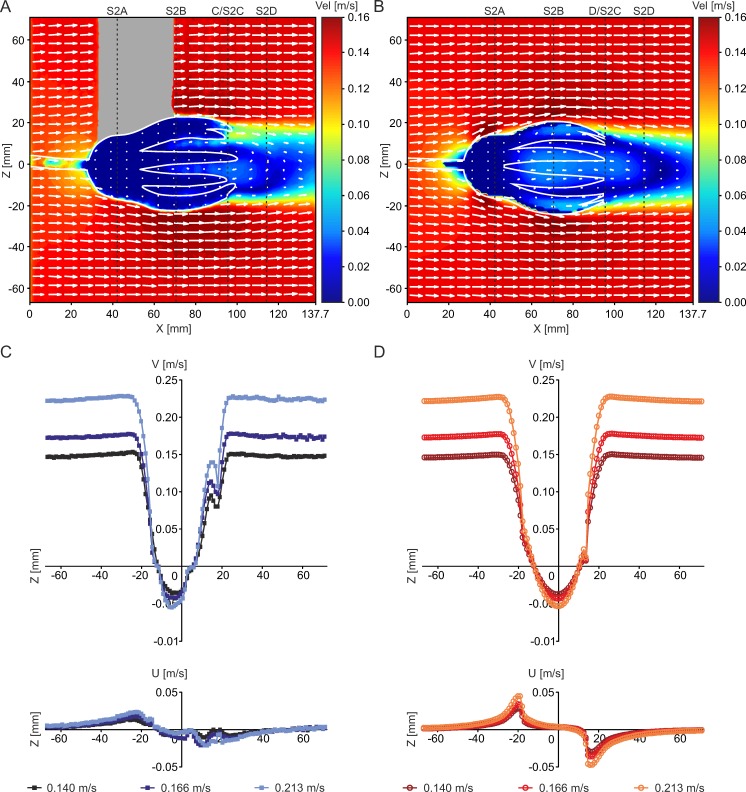
Fig 6. Summarized results of PIV experiments and CFD simulations.
(A) Combined contour-vector plot illustrating PIV results at Vinit = 0.14 m/s. (B) Combined contour-vector plot illustrating CFD results at Vinit = 0.14 m/s. (C) Velocity component V and U of PIV experiments for all three inflow velocities, measured along a line parallel to the z-axis (location indicated by dotted line in (A)). (D) Velocity component V and U of CFD simulations for all three inflow velocities, measured along a line parallel to the z-axis (location indicated by dotted line in (B)).

