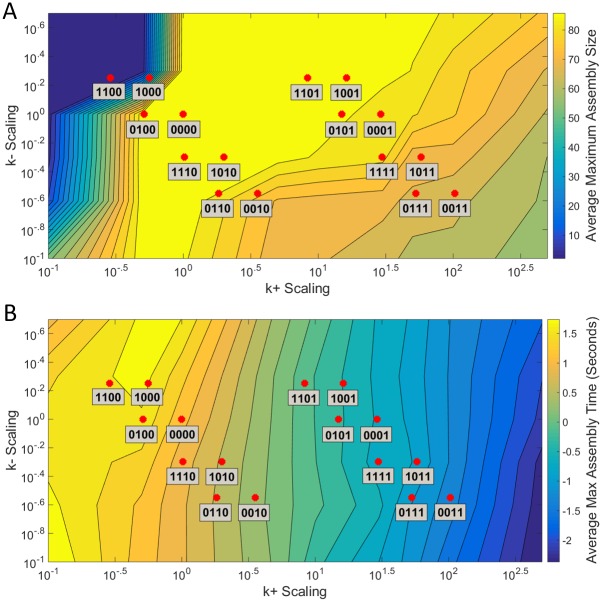
Fig 1. Contour plots of maximum assembly size and assembly time over the space of rate parameters.
(A) Contour plot of the average maximum assembly size for 54 rate parameter grid points and 16 RNA effect combinations (red dots). The colorbar shows average maximum assembly size. A completed CCMV capsid consists of 90 subunits. (B) Contour plot of the average time to reach a maximum assembly size for a simulation over the same grid points and effect combinations. The colorbar shows time in seconds. The four-digit binary codes for simulations are as explained in Table 1, with a zero in each bit corresponding to absence of a given RNA effect and a one in that bit to presence of the corresponding effect. The first digit represents RNA-RNA, the second Compression, the third RNA-protein, and the fourth Concentration.

