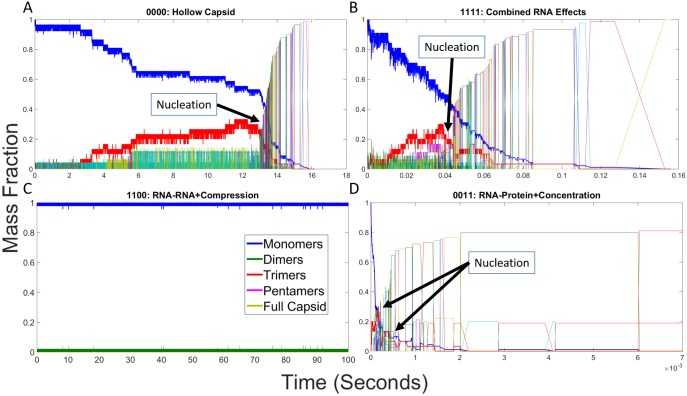
Fig 4. Mass fraction plots for representative combinations of RNA effects.
Mass fraction plots for (A) hollow CCMV capsid assembly, (B) CCMV capsid assembly with all combined RNA effects, (C) CCMV capsid assembly under both negative effects (1100), and (D) CCMV capsid assembly under both positive effects (0011). Each plot measures the mass fraction of each potential assembly size from individual monomers to completed capsids at each time point in a single simulation run. Approximate locations of putative nucleation events are labeled in each plot. Note that the time axis is on a different scale for each plot due to the very different timescales of the assembly reaction under the different effects models.

