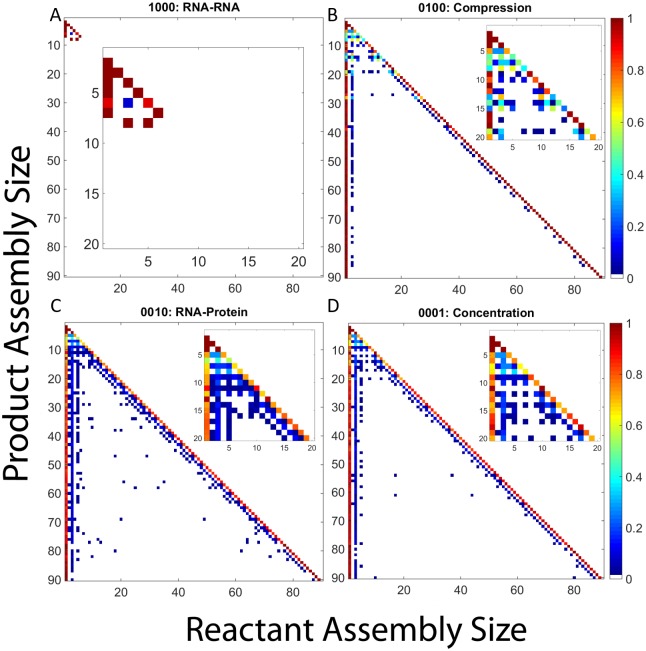
Fig 12. Frequency matrix plots for CCMV capsid assembly with individual RNA effects.
Frequency matrix plots averaged over 200 simulation runs for CCMV capsid assembly upon applying: (A) RNA- RNA, (B) Compression, (C) RNA-protein, (D) Concentration. In each plot, each row corresponds to a product size and each column to reactant sizes that produce that product. Pixel color in each position corresponds to the frequency with which the given reactant size is used to produce the given product size. Insets within each plot expand the upper-left corner of the main plot, corresponding to products of size 20 or smaller, to better visualize pathways involved in production of small oligomers.

