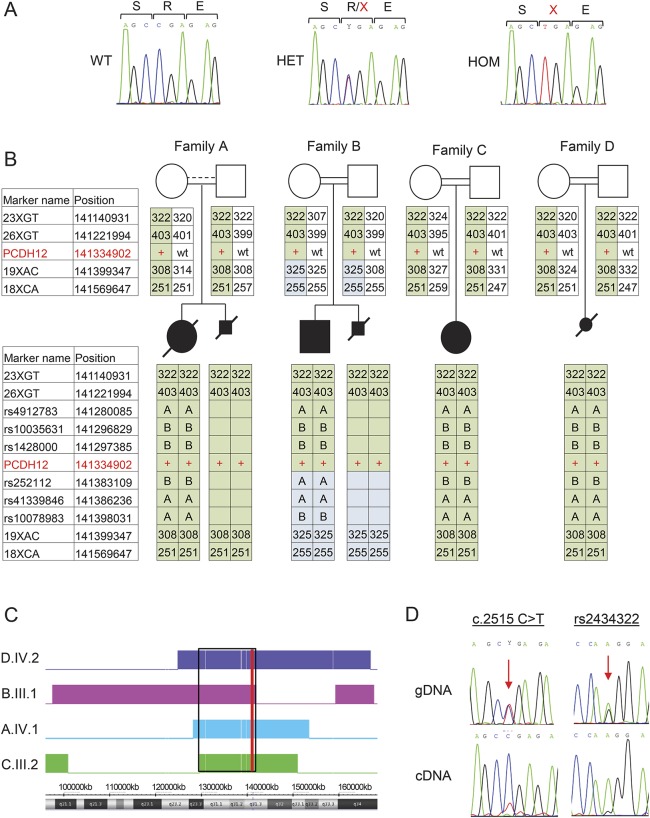
Figure 3. Genetics and expression analysis.
(A) Sanger sequences of PCDH12 c.2515C>T in genomic DNA of a control with wild-type (WT) sequence, and of individuals from family A who are heterozygous (HET) and homozygous (HOM) for the mutation. Nucleotides and expected aminoacid sequence are shown above the chromatograms. (B) Haplotype analysis of the genomic region flanking PCDH12 c.2515C>T. Markers used were short tandem repeat markers (numbers indicate amplicon size, bp) and single nucleotide polymorphisms (dbSNP build 142, letters A or B indicate genotype). Names and genomic positions (hg19) of tested markers on chromosome 5 are indicated, with PCDH12 c.2515C>T indicated in red. The disease-linked haplotype shared in all families is shaded in green. (C) Homozygosity mapping of patients, analyzed by Chromosome Analysis Suite. Homozygous regions for each individual are indicated by a colored block; genomic location is shown beneath. The shared region of homozygosity on chromosome 5 from 129,673,384 to 141,354,220 (hg19) is indicated by a black rectangle. The position of PCDH12 is indicated with a red line. (D) Expression of PCDH12 WT and mutant transcripts. Sanger sequencing of genomic DNA (gDNA) shows equal peak heights for WT and mutant DNA sequences, both at PCDH12 c.2515C>T and at a nearby polymorphism, rs2434322. Allele G of rs2434322 is in cis with PCDH12 c.2515C>T. In contrast, Sanger sequencing of cDNA reveals much lower expression of the mutant compared to the WT transcript: TA cloning showed a 14:88 ratio (see Results).

