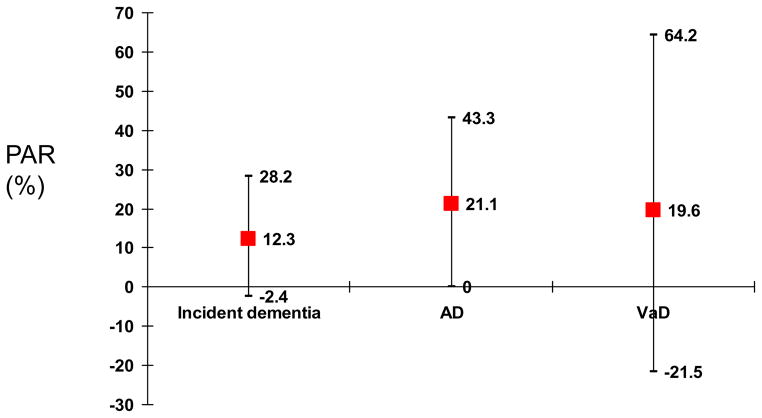
Figure 3.
Population Attributable Risk with 95% CI for obesity and dementia and its subtypes using current estimates of adult obesity prevalence (NHANES, 1999–2002)*
Source: 34
*Estimates of obesity prevalence were applied to the PAR formula as the average for the age groups (40–59 and 60+), which was 33.35%.

