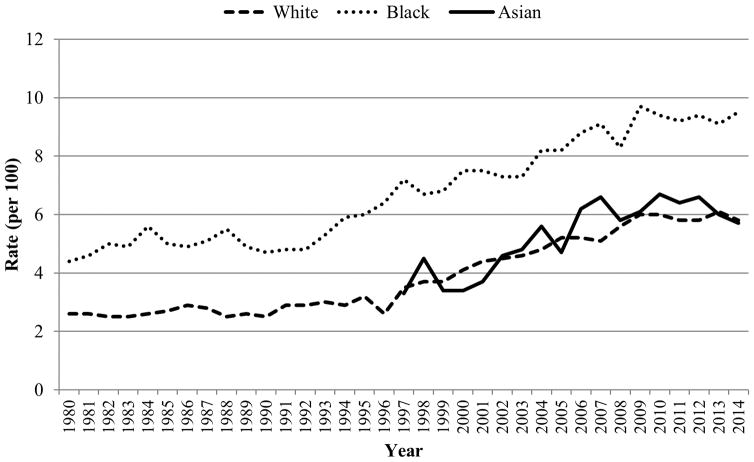
Figure 5.
Trends in age-adjusted rates of diagnosed diabetes per 100 civilian, non-institutionalized population in the US, by Race, 1980–201431. Data source: Centers for Disease Control and Prevention, National Center for Health Statistics, Division of Health Interview Statistics, data from the National Health Interview Survey

