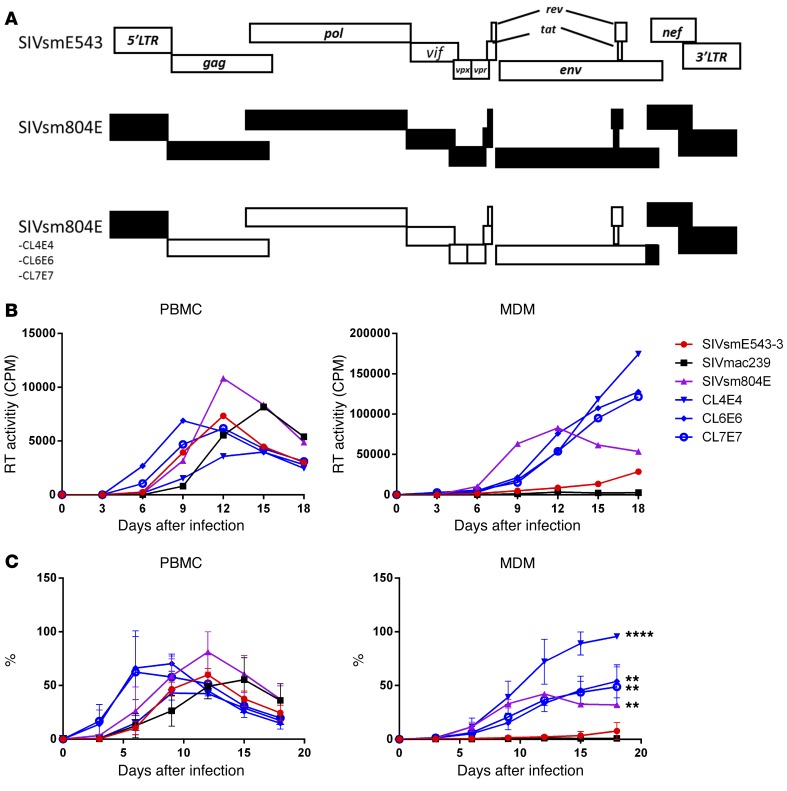
Figure 1. Viral replication in PBMC and MDM.
(A) Schematic diagram of SIVsmE543-3, SIVsm804E, and 3 chimeric clones. White bars indicate open reading frames (ORF) from SIVsmE543-3; black bars indicate ORF from SIVsm804E. (B) Replication kinetics of SIVmac239, SIVsmE543-3, SIVsm804E, and 3 chimeric SIVsmE543-3 clones containing 3′ gp41/nef/LTR from SIVsm804E on PBMCs and MDMs. Three independent experiments were conducted with PBMC and MDM obtained from donors RhDCCW and RhMO3. A representative experiment is shown (donor RhMO3). (C) Mean replication efficiency normalized as percentage of maximal replication activity reached for different cell preparations infected with indicated set of viruses are plotted. The bars represent the standard errors of the means of normalized values obtained on cells isolated from different macaques. **P ≤ 0.01 and ****P ≤ 0.0001, 2-way ANOVA (replication kinetics of chimeric clones compared with SIVsmE543).

