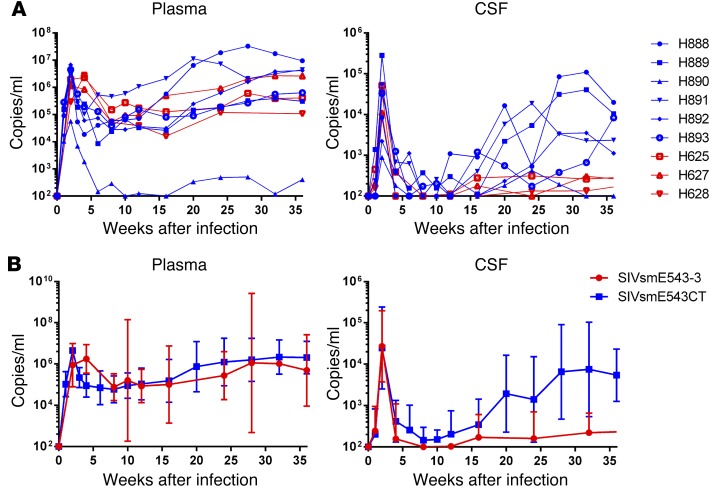
Figure 9. In vivo replication of SIVsmE543CT#154.
(A) Plasma and CSF viral RNA loads. Red lines indicate SIVsmE543-3–infected animals, and blue line indicate SIVsmE543CT#154-infected animals. (B) Geometric mean with 95% CI of plasma and CSF viral loads. H890 is excluded from the group, since this animal controlled viral replication systemically for unknown reasons.

