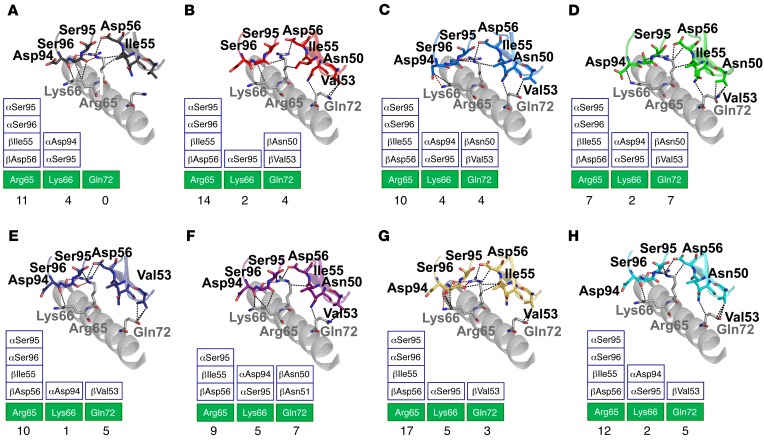
Figure 7. The 1E6 TCR makes distinct peptide contacts with the MHC surface depending on the peptide cargo.
Interactions between the 1E6 TCR and the MHC α1 helix residues Arg65, Lys66, and Gln72. Hydrogen bonds are shown as red dotted lines; vdW contacts are shown as black dotted lines. MHCα1 helix are shown in gray illustrations. Boxes show total contacts between the 1E6 TCR and these key residues (green boxes are MHC residues; white boxes are TCR residues). (A) Interaction between the 1E6 TCR (black illustration and sticks) and A2-MVWGPDPLYV (black illustration and sticks). (B) Interaction between the 1E6 TCR (red illustration and sticks) and A2-YLGGPDFPTI (red illustration and sticks). (C) Interaction between the 1E6 TCR (blue illustration and sticks) and A2-ALWGPDPAAA (blue illustration and sticks) reproduced from previous published data (21). (D) Interaction between the 1E6 TCR (green illustration and sticks) and A2-AQWGPDPAAA (green illustration and sticks). (E) Interaction between the 1E6 TCR (dark blue illustration and sticks) and A2-RQFGPDWIVA (dark blue illustration and sticks). (F) Interaction between the 1E6 TCR (purple illustration and sticks) and A2-RQWGPDPAAV (purple illustration and sticks). (G) Interaction between the 1E6 TCR (yellow illustration and sticks) and A2-YQFGPDFPTA (yellow illustration and sticks). (H) Interaction between the 1E6 TCR (cyan illustration and sticks) and A2-RQFGPDFPTI (cyan illustration and sticks).

