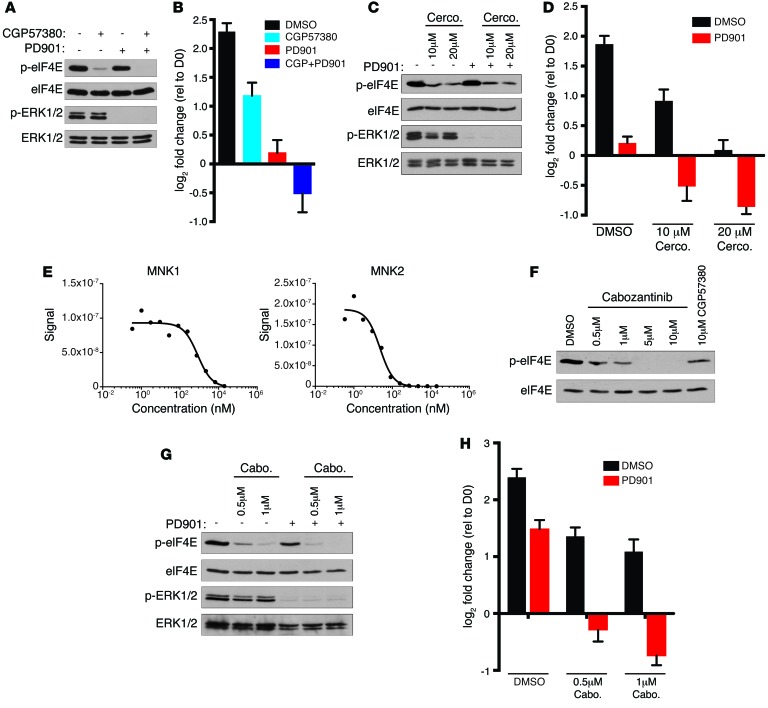
Figure 3. Multiple therapeutic agents that suppress MNK kinases cooperate with MEK inhibitors.
(A) p-eIF4E and p-ERK1/2 levels in S462 cells treated with DMSO, 10 μM CGP57380, 750 nM PD901, or both inhibitors for 24 hours. (B) Change in cell number of S462 cells treated with 10 μM CGP57380 (CGP) or 750 nM PD901 alone or in combination. Graph represents the average log2 of fold change in cell number 72 hours after treatment relative to time 0 (mean ± SD, n = 3). (C) p-eIF4E and p-ERK1/2 levels in S462 cells treated with indicated concentrations of cercosporamide (Cerco.) alone or in combination with 750 nM PD901 for 24 hours. (D) Change in cell number of S462 cells treated with 10 μM or 20 μM cercosporamide or 750 nM PD901 alone or in combination. Graph represents the average log2 of fold change in cell number 72 hours after treatment relative to time 0 (mean ± SD, n = 3). (E) Binding of tagged MNK1 and MNK2 to immobilized ligand was measured in the presence of increasing cabozantinib. Tagged MNK kinases were quantified by real-time qPCR using previously described methods (26). Representative curves are shown. (F) Levels of p-eIF4E following 24 hours of treatment with increasing concentrations of cabozantinib or 10 μM CGP57380. (G) p-eIF4E and p-ERK1/2 levels in S462 cells treated with 0.5 μM or 1 μM cabozantinib (Cabo) alone or in combination with 750 nM PD901 for 24 hours. (H) Change in cell number of S462 treated with the indicated concentrations of cabozantinib or 750 nM PD901 alone or in combination. Graph represents the average log2 of fold change in cell number 72 hours after treatment relative to time 0 (mean ± SD, n = 3). Experiments repeated at least 3 times for validation.

