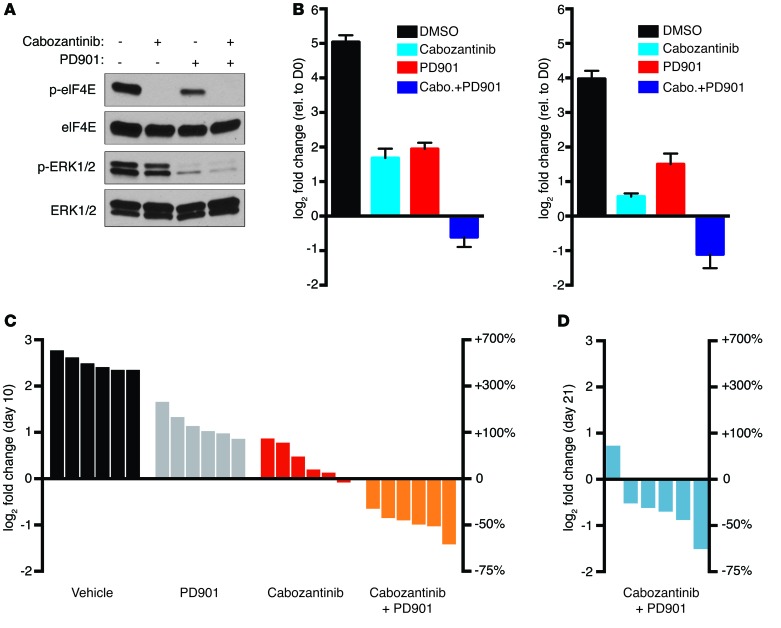
Figure 5. Combined cabozantinib and PD901 treatment induces tumor regression in vivo.
(A) Levels of p-eIF4E and p-ERK1/2 in CM261 cells (mouse MPNST line) treated with 5 μM cabozantinib and 2 μM PD901 alone or in combination. (B) Graph depicting the change in cell number of mouse (CM261, left, and CM173, right) MPNST cells treated with 5 μM cabozantinib or 2 μM PD901 alone or in combination. Graph represents the average log2 of fold change in cell number 96 hours after treatment relative to time 0 (mean ± SD, n = 3). Experiments repeated at least 3 times for validation. (C) Waterfall plot depicting change in tumor volume after 10 days of treatment with cabozantinib at 12.3 mg/kg/d (red bars) or in combination with PD901 at 1.5 mg/kg/d (orange bars) (P = 0.0022, Mann-Whitney U test, cabozantinib vs. cabozantinib + PD901), as compared with vehicle (black), and 1.5 mg/kg/d PD901 alone (gray). Vehicle and PD901 tumor responses are previously published historic controls adapted with permission from Cancer Discovery (11). (D) Waterfall plot of the change in tumor volume of mice treated with 12.3 mg/kg/d cabozantinib in combination with 1.5 mg/kg/d PD901 for 21 days. For both C and D, each bar represents an individual tumor-bearing mouse. The left y axis indicates the log2 of the fold change in volume over the indicated time relative to day 0 measurements. The right y axis indicates the equivalent percentage change in tumor volume.

