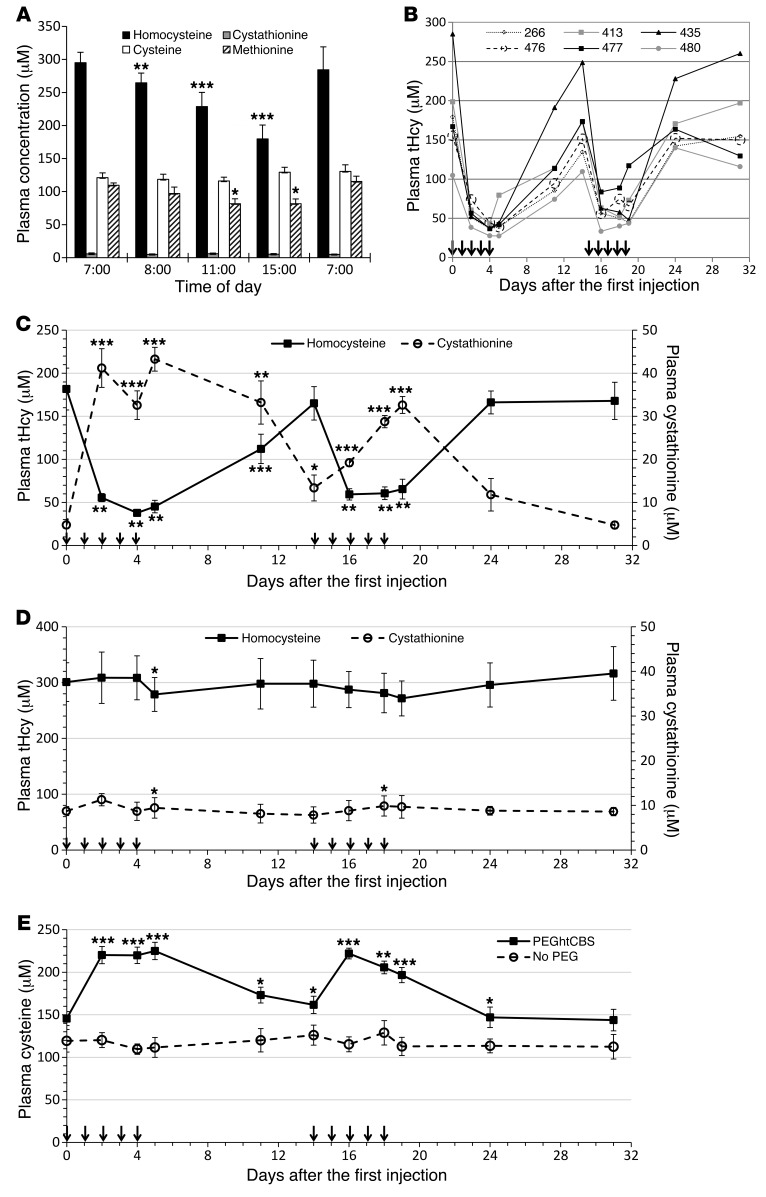
Figure 3. Repeated injection of PEGhtCBS significantly impacts tHcy, cystathionine, and cysteine plasma levels.
(A) Metabolites levels in HO mice (n = 6) throughout a 24-hour cycle. (B) tHcy levels in individual HO mice (n = 6) that were injected with 5 mg/kg PEGhtCBS for 5 consecutive days on weeks 1 and 3. (C) Mean tHcy and cystathionine levels of the animals described in B. See Figure 4 for typical levels of metabolites in untreated HO mice. (D) Mean tHcy and cystathionine levels in HO mice (n = 5) that were injected with 5 mg/kg non-PEGylated htCBS for 5 consecutive days on weeks 1 and 3. (E) Comparison of cysteine levels in the animals injected with PEGylated versus non-PEGylated htCBS. Data in A, C, and D are presented as the mean ± SEM and are compared with time 0 values, using a paired Student’s t test. Data in E are presented as the mean ± SEM, and each time point is compared between the 2 groups using an unpaired Student’s t test. *P ≤ 0.05, **P ≤ 0.01, and ***P ≤ 0.001. Arrows in panels B–E represent injection times.

