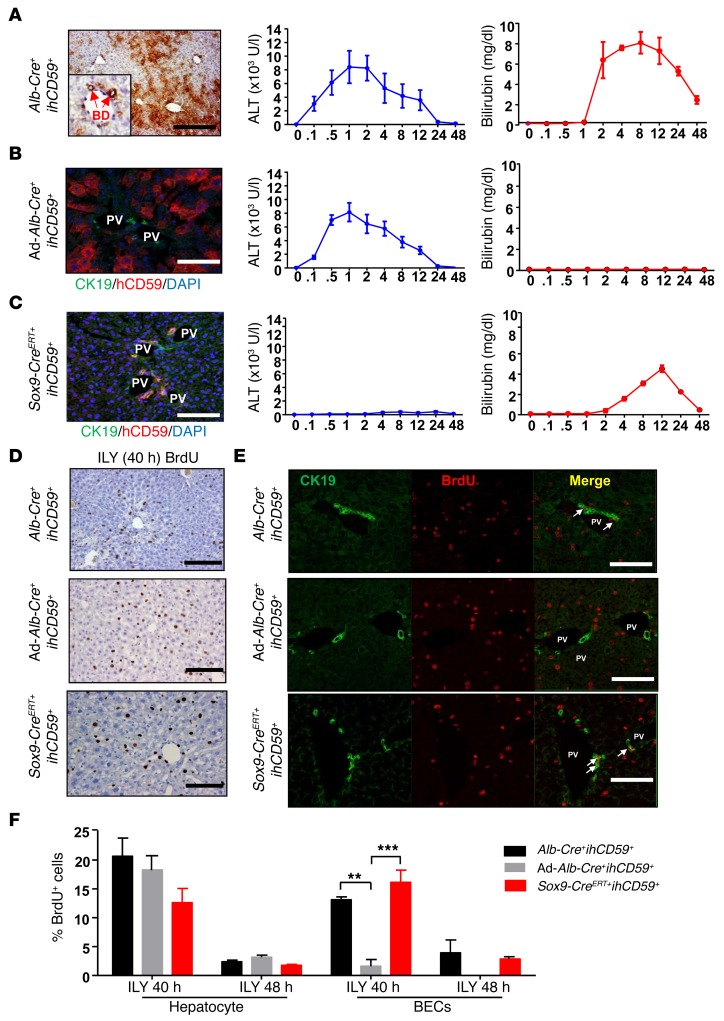
Figure 6. Highly selective ablation of hepatocytes and/or BECs in Cre+ihCD59+ mice after ILY injection.
(A–C) Three lines of Cre+ihCD59+ mice were generated. Representative immunostaining images (from 9 mice in each group) on the left show hCD59 protein expression in both hepatocytes and BECs in Alb-Cre+ihCD59+ mice (brown staining in A), hCD59 expression in hepatocytes only in Ad-Alb-Cre+ihCD59+ mice (red staining in B), and hCD59 protein expression in BECs in Sox9-CreERT+ihCD59+ mice (C, CK19 and CD59 costaining) after tamoxifen treatment. These mice were given a single ILY injection (150 ng/g, i.v.), followed by the measurement of serum ALT and bilirubin. BD, bile ducts; PV, portal vein. (D–F) Liver regeneration after ILY-mediated ablation of hepatocytes and/or BECs. Cre+ihCD59+ mice (n = 7 in each group) received 150 ng/g ILY (i.v.) and were euthanized 40 or 48 hours after ILY injection. BrdU (50 mg/kg) was given 2 hours before sacrifice. Representative immunohistochemical staining of BrdU (D, n = 9) or immunofluorescence staining of BrdU and CK19 (E, n = 9, arrows indicate double-positive cells) in the livers of ILY-treated mice (40 hours after ILY injection). The percentages of BrdU+ hepatocytes and BECs from 40 and 48 hours after ILY treatment were determined (F). Scale bars: 100 μm. Values represent mean ± SD (n = 9). **P < 0.01; ***P < 0.001. Comparisons between groups as indicated in the figure were determined by 1-way ANOVA followed by Bonferroni’s post-hoc test.

