Figure 3.
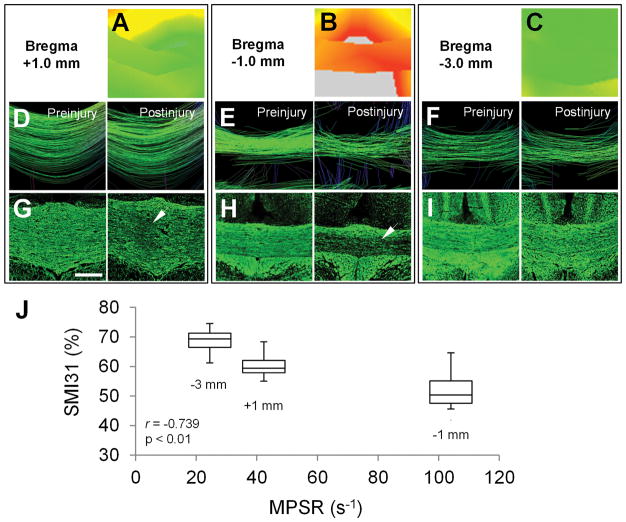
(A–C) Magnified from the locations denoted in Figure 2A, the maximum principal strain rate (MPSR) maps show that the corpus callosum (CC) endured the highest MPSR at bregma −1.0mm, where the diffuse axonal injury most likely occurred. (D–I) Correspondingly, the DTI tractography (D–F) and the phosphorylated neurofilament H (SMI31) neurofilament staining (G to I) also show that the most loss of white matter tracts and neurofilament staining were at bregma −1.0mm (arrow in H). Moderate injury signs are shown in the CC at bregma +1.0mm (arrow in G) and only few injuries were seen in the CC at bregma −3.0mm (I). (J) A strong negative correlation (r = −0.739, p = 0.002) is seen between the positive SMI31 staining and averaged MPSR. Scale bar = 400 μm.

