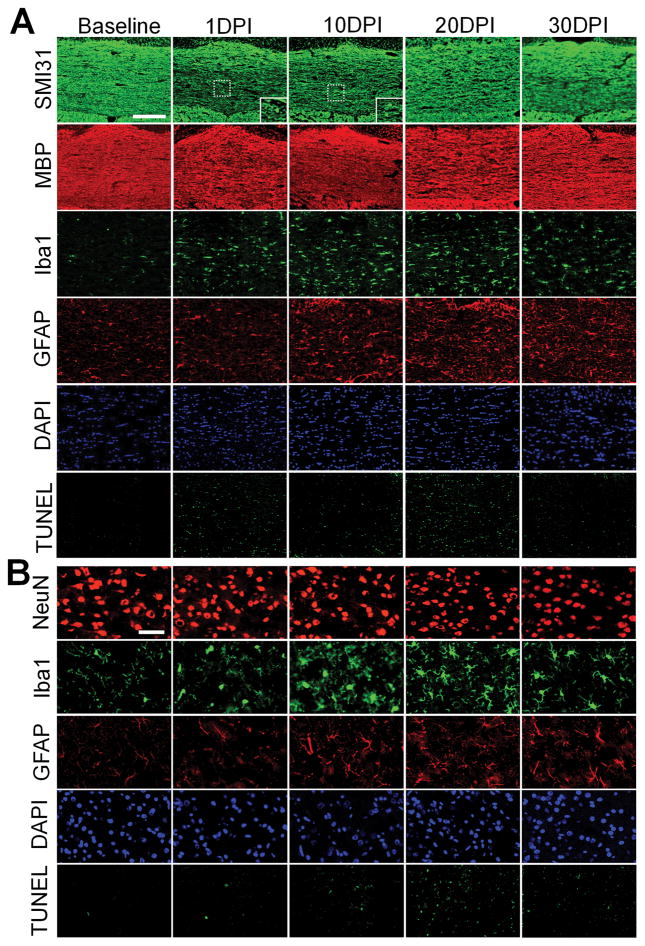
Figure 6.
Representative images of the immunofluorescent staining of (A) corpus callosum and (B) cortex show diffusive axonal injury pathologies in traumatic brain injury model. Phosphorylated neurofilament H (SMI31) staining clearly shows axonal injury at 1 day postinjury (DPI) and gradually recovers afterward, whereas myelin basic protein (MBP) staining shows low degree of perturbation during the injury time course (A). Neurite beadings are clear seen in the magnified images at 1 DPI and 10 DPI. Ionized calcium-binding adaptor molecule 1 (Iba1) staining displays microgliosis peaks at 10 DPI, and decreases after 30 days. Glial fibrillary acidic protein (GFAP) progressively increases up to day 30. 4,6-Diamidino-2-phenylindole (DAPI) shows a trend of increased cellularity over time. Hexaribonucleotide binding protein 3 (NeuN) staining shows a trend of decreased staining intensity over time although not significantly (B). Iba1 staining displays the maximum microgliosis appearing at 10 DPI and 20 DPI, and then normalizes after 30 DPI. GFAP progressively increases to day 30. DAPI shows a consistent trend but with a slight decrease at 10 DPI. An increased pattern of mild-to-moderate apoptotic cell death is seen in the TUNEL staining from 1 DPI to 20 DPI. The apoptotic cell death is largely declined at 30 DPI. The TUNEL positive staining shows more in the corpus callosum demonstrating the pattern of diffuse axonal injury. The images were captured from the corpus callosum and cortex at the bregma −1.0 mm denoted in Figure 2F. Scale bar = 200 μm (A), 50 μm (B).

