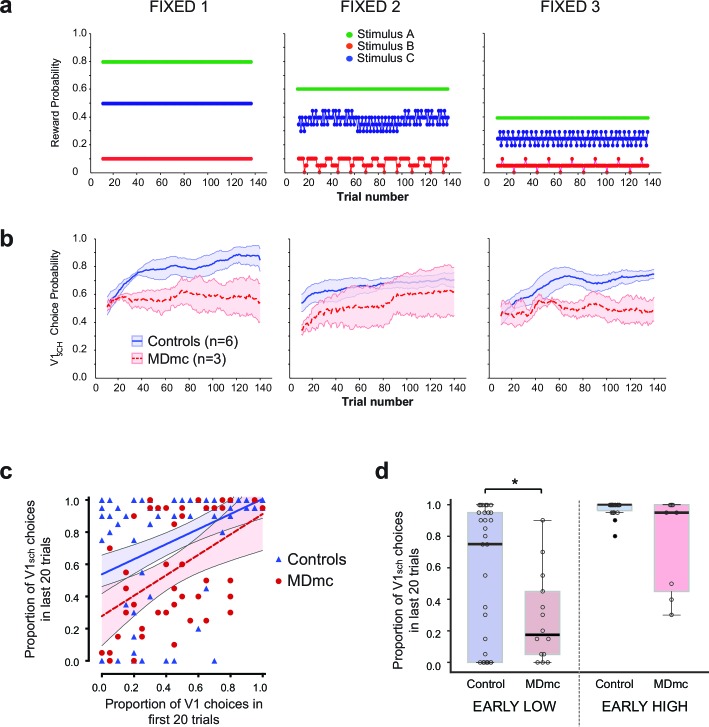
Figure 7. Fixed schedule performance.
(a–b) Schematic of Fixed schedules (upper panels, a) and average proportion of choices ( ± S.E.M.) of the V1sch in the control and MDmc groups in each schedule (lower panels, b). (c) Proportion of V1sch choices in the first and last 20 trials in each session for each animal, plotted along with the best-fit linear regression and 95% confidence limits for each group (Controls or MDmc). (d) Box plots showing average proportion V1sch choices in the last 20 trials for sessions in which animals made a low number of V1sch choices in the first 20 trials (≤25% V1sch choices; 'EARLY LOW') or a high number of V1sch choices in the first 20 trials (≥75% V1sch choices; 'EARLY HIGH'). For all box plots, the central mark is the median, the edges of the box are the 25th and 75th percentiles, and the whiskers extend to the most extreme data points not treated as outliers. (*p<0.05, Independent Samples Kolmogorov-Smirnov Test, treating each session as an independent sample.)

