. 2016 May 31;5:e13546. doi: 10.7554/eLife.13546

Figure 2. Hyperosmotic stress-induced differentially methylated regions (DMRs) in the absence of stress stimulus.

(A) Annotation of cytosines in MRs and DMRs between P0 control and P0 hyperosmotic treated samples in different generations (see Figure 1A). (B) Methylation frequencies by sequence context in DMRs identified between control (P0 of G5), stress-treated (P0 of G5), and the derived P1 and P2 plants (unpaired two-tailed Student’s t-test; ***p<0.001, ns p>0.05). Horizontal bar corresponds to median, whiskers indicate entire 95th percentile. (C) Complete linkage clustering of samples from different generations based on DMR methylation frequencies. Methylation frequency of cytosines contained in each DMR were averaged, and only DMRs covered in all samples were considered. Numbers in red indicate approximately unbiased (AU) p-values (x100), calculated with pvclust. (D) Overlap (including 500 bp flanking windows) of DMRs between P0 control and stress-treated samples from G1, G3 and G5. Overlap with DMRs from a previous analysis of mutation accumulation (MA) lines (Hagmann et al., 2015) is also shown. (E) Clustering of DMRs between P0 control and stress-treated samples in G5 according to overlap with MA-DMRs. C, control, 25, 25 mM NaCl and 75, 75 mM NaCl.

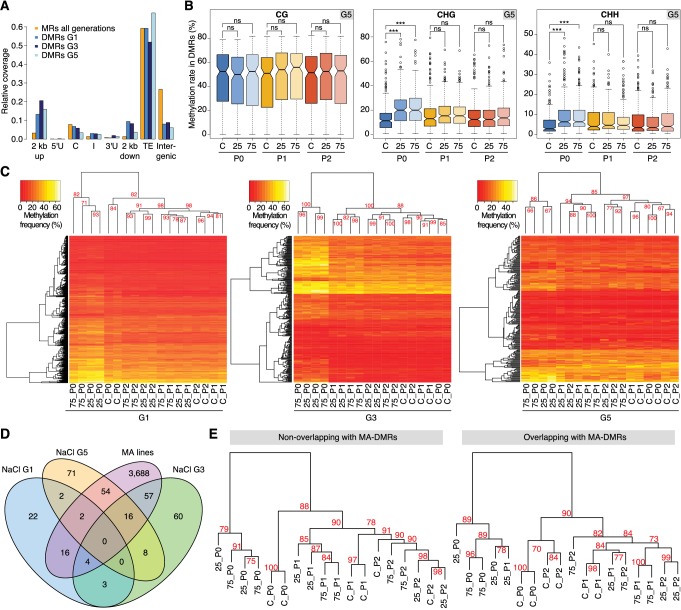
Figure 2.

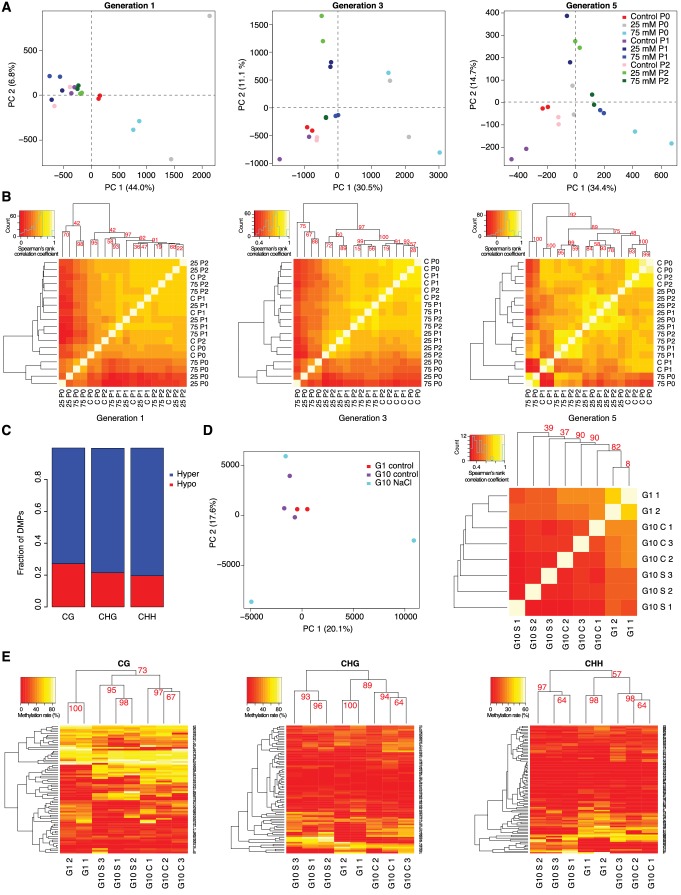
Figure 2—figure supplement 1. DNA methylation variation after multigenerational hyperosmotic stress.

Figure 2—figure supplement 1.

(A) Principal component (PC) analysis of methylation frequencies at DMPs in each generation, with full information across all samples of that generation. Numbers in brackets indicate the percentage of variation explained by the respective PC. (B) Complete linkage clustering of pairwise correlation of DMP methylation frequencies, separated by generation. (C) Fraction of hyper- and hypo-methylated DMPs after salt-treatment of P0 samples. (D and E) Analyses based on data published by Jiang et al. (2014). G1: generation 1. G10: plants after 10 generations of either control of NaCl treatment. (D) Reanalysis of published hyperosmotic stress data (Jiang et al., 2014). PC analysis of methylation frequencies at DMPs (left panel). Bi-hierarchical clustering of pairwise correlation of methylation frequency at DMPs identified in all pairwise comparisons, with full information across all samples (right panel). (E) Reanalysis of previously published hyperosmotic stress data (Jiang et al., 2014). Complete linkage clustering based on DMR methylation frequencies, divided by sequence context. The methylation frequency of each DMR per sample was calculated as the average methylation frequency of cytosines in that DMR. Only DMRs covered in each sample were considered. G1, untreated generation 1; G10, generation 10; C, control; S, salt-treated.
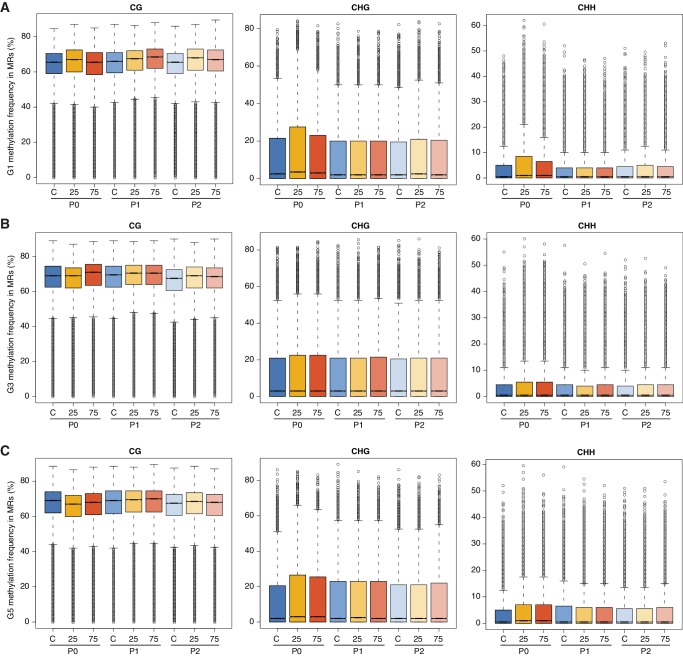
Figure 2—figure supplement 2. Effect of hyperosmotic-stress on global methylation.

Figure 2—figure supplement 2.

Methylation frequencies in MRs of plants from different generations, divided by sequence context. 25, 25 mM NaCl; 75, 75 mM NaCl; C, control.
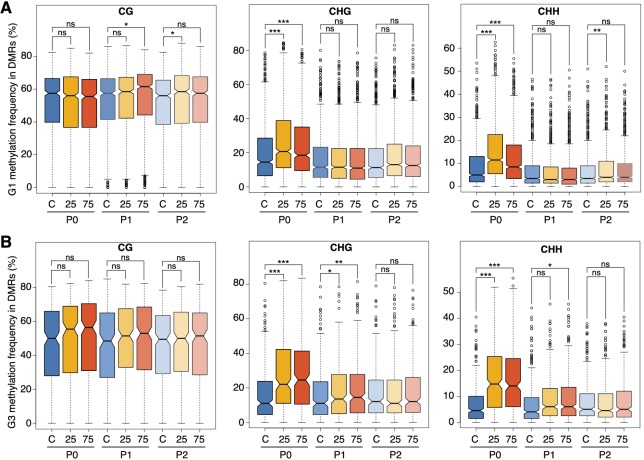
Figure 2—figure supplement 3. Hyperosmotic-stress induced methylation changes in DMRs.

Figure 2—figure supplement 3.

Methylation frequencies in MRs of plants from different generations, divided by sequence context (unpaired Student’s t-test; * p<0.05, ** p<0.01, *** p<0.001, ns p>0.05). C, control; 25, 25 mM NaCl; 75, 75 mM NaCl.
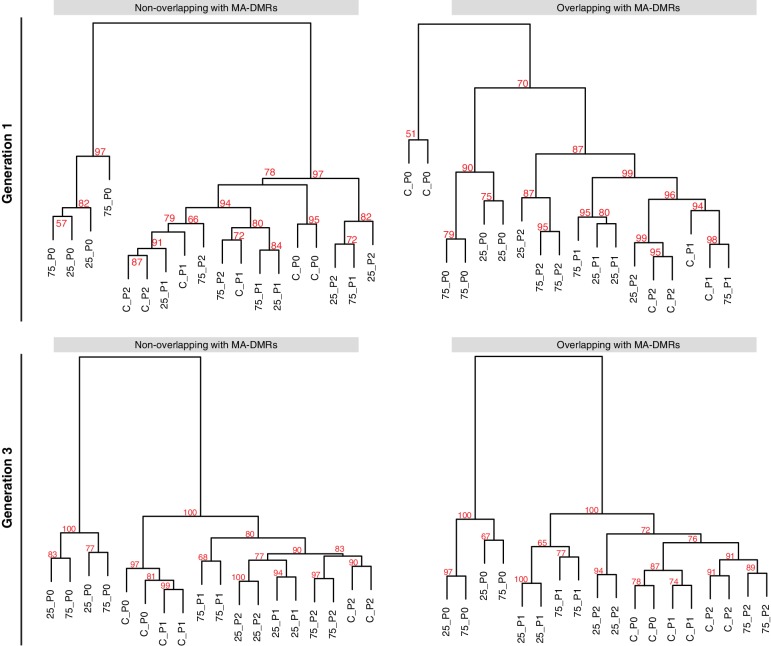
Figure 2—figure supplement 4. Overlap of HS-DMRs with MA-DMRs.

Figure 2—figure supplement 4.

(A-B) Clustering of DMRs between P0 control and salt-treated samples in generations 1 and 3, separated according to overlap with DMRs in MA lines (Hagmann et al., 2015).
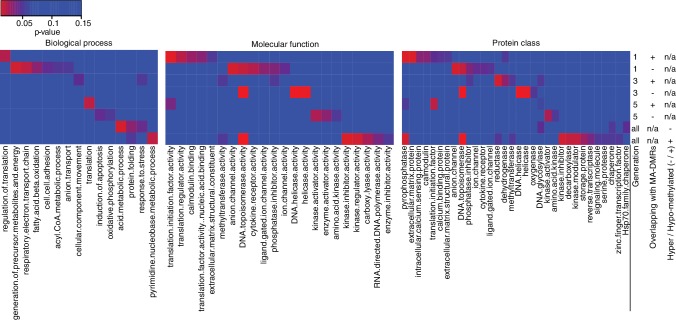
Figure 2—figure supplement 5. Gene Ontology analysis of genes associated to HS-DMRs.

Figure 2—figure supplement 5.

Heatmaps of significantly enriched GO categories among hypo-/hypermethylated salt-stress induced DMRs that overlap or do not overlap with DMRs identified in MA lines (Hagmann et al., 2015) (p-value<0.05).