. 2016 May 31;5:e13546. doi: 10.7554/eLife.13546

Figure 4. Parent-of-origin effects on stress-induced epimutations.

(A) Survival of F1 seedlings derived from reciprocal crosses between Col-0 wild type or dme-6 mutants that had been exposed to hyperosmotic stress for two generations and untreated wild-type (wt), or progeny of dme-6/+ selfed plants (unpaired Student’s t-test; *p<0.05, **p<0.01, ***p<0.001, ns p>0.05). (B) Absolute methylation frequency differences in DMRs in different tissues from control and stress-treated plants (unpaired, two-sided Student’s t-test; ***p<0.001, ns p>0.05). C, control; 25, 25 mM NaCl; 75, 75 mM NaCl. (C) Genome-wide methylation levels in leaves and pollen derived from control and salt-stressed P0 plants (generation G1). Methylation frequency was calculated as the average methylation frequency of cytosines in a 250 kb window. Chr, chromosome. (D) Overlap of DMRs from the comparison of vegetative nuclei and sperm cells with DMRs identified in leaf tissue after salt treatment in G1, G3, G5. (E) Annotation of MRs and DMRs in vegetative nuclei and sperm cells.

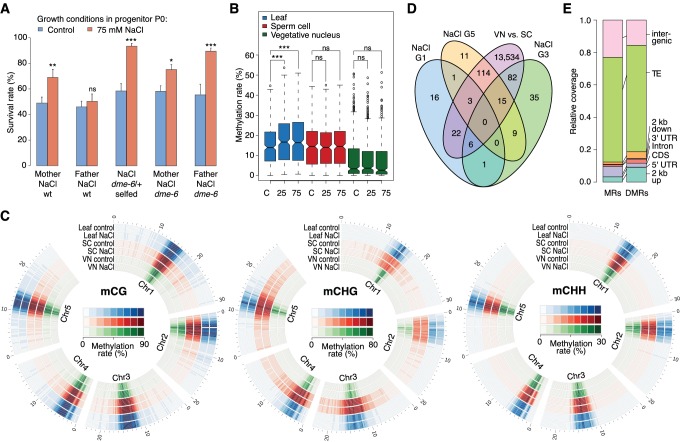
Figure 4.

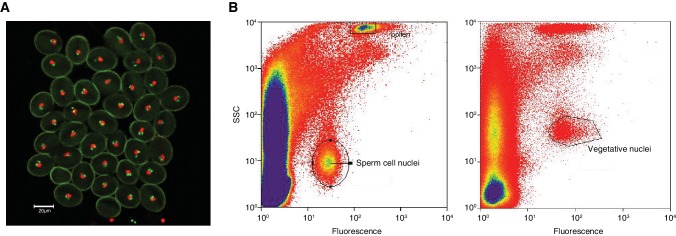
Figure 4—figure supplement 1. Isolation of sperm cells and vegetative nuclei by fluorescent-activated-cell-sorting.

Figure 4—figure supplement 1.

(A) Confocal microscopy image (25x) of pollen from the A. thaliana pMGH3::MGH3-eGFP/pACT11::H2B marker line. pMGH3::MGH3-eGFP expression marks the sperm cell nuclei (green); pACT11p::H2B-mRFP expression labels vegetative cell nuclei (red). (B) Isolation of sperm and vegetative cells by Fluorescence-Activated-Cell-Sorting (FACS) of sperm cell and vegetative nuclei were isolated based on their GFP and RFP signal, respectively, as well as on their intra-cellular complexity (side scatter, SSC) and particle size (forward scatter, FSC).
Figure 4—figure supplement 2. Methylation at hyperosmotic stress-induced DMRs in the dme-6 mutants.

Figure 4—figure supplement 2.

Methylation frequency difference in sperm cells (SC) and vegetative nuclei (VN); original sequencing data was taken from Ibarra et al. (2012). Differences were calculated by subtracting the methylation frequency of each DMR from its methylation frequency in the Col-0 wild-type control samples. Blue colour indicates hyper-, red colour indicates hypomethylation