
Fig. 1.
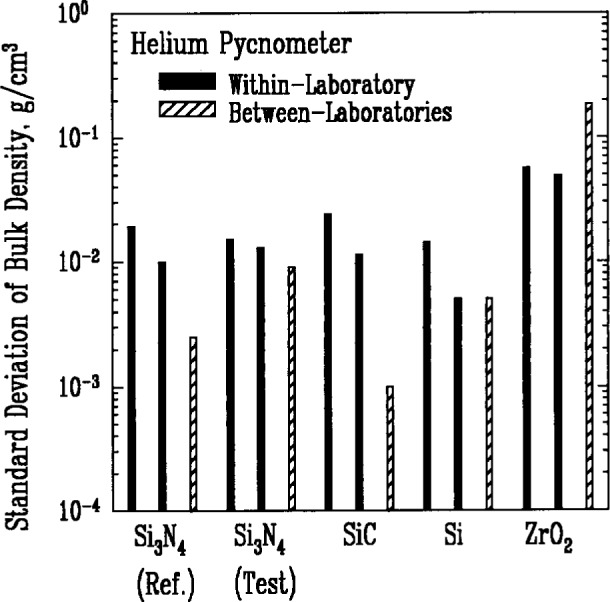
Within-laboratory and between-laboratory standard deviations in the measurements of bulk density for five powders as measured by various laboratories using the helium pycnometer method. Solid bars represent results from individual laboratories. Not all laboratories had sufficient data to calculate a meaningful standard deviation. A bar with diagonal shading represents the standard deviation of the mean values determined by the various laboratories for the indicated powder.