
Figure 3.
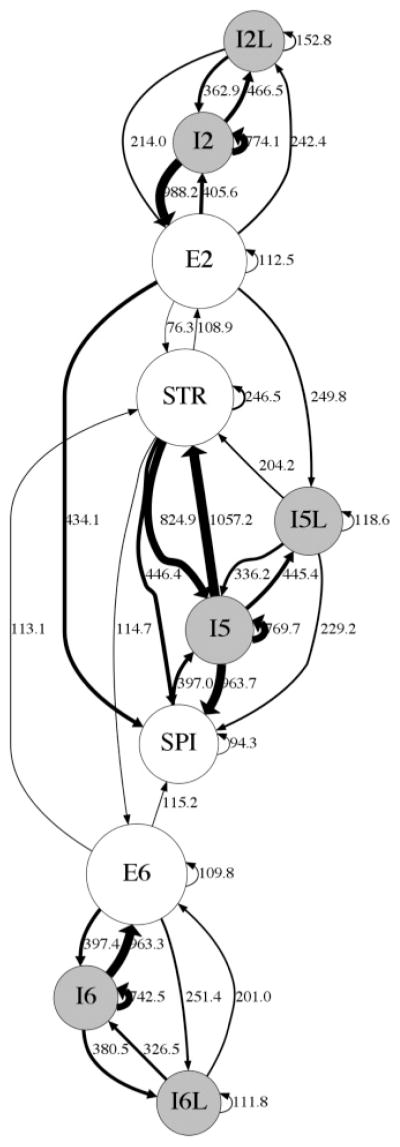
Connectivity strength view of network: edge thickness is proportional to the normalized strength (product of weight and convergence normalized by population size). Node size is proportional to population count. Self-connections are shown as small looping arrows.